

Nossos serviços estão apresentando instabilidade no momento. Algumas informações podem não estar disponíveis.
-
Home

-
Statistics
-
Social
-
Education
- NP-Novo Portal
Population Census
About - Demographic trends: an analysis of universe results
It presents data and indicators taken from the universe results of Population Census 2000, encompassing information about the Brazilian population, including: territorial distribution, age structure, increase of the number of elderly persons, evolution of literacy, social and economic profile of the heads of permanent private housing units, as well as household conditions and access to sanitation services in these same housing units.
The volume about Brazil presents results such as tables and graphs by Major Regions, Federative Units and metropolitan areas, including analyses of the changes observed and trends of these indicators, based in the latest censuses. The volume about each Federative Unit presents the analysis of results obtained for this geographic area, illustrated with graphs. All these data are included in the CD ROM which comes enclosed with the publication.
This publication is a valuable source for researchers of Brazil 's demographic status.
Tables - Demographic trends: an analysis of universe results
- -Table 48 #Censo2000
- -Table 48 - Conclusion #Censo2000
- -Table 52 #Censo2000
- -Tabela 56 #Censo2000 (2)
- -Complete tables (zip) #Censo2000
- -Table 23 #Censo2000
- -Table 30 #Censo2000
- -Table 40 #Censo2000
- -Table 1 #Censo2000 (3)
Table 48
Proportion of permanent private households, by existence of bathroom or toilet and type of sanitary sewage according to Major Regions and Federation Units - 1991/2000
| Major Regions and Federation Units | Proportion of permanent private households by existence of bathroom or toilet and type of sanitary sewage (%) |
|||||||
|---|---|---|---|---|---|---|---|---|
| Had either bathroom or toilet | ||||||||
| Total | Type of sanitary sewage | |||||||
| Public sewer system or rainwater network | Septic tank |
Rudimentary cesspit |
||||||
| 1991 | 2000 | 1991 | 2000 | 1991 | 2000 | 1991 | 2000 | |
| Brazil | 85.29 | 91.73 | 35.36 | 47.24 | 17.14 | 14.96 | 25.88 | 23.65 |
| North | 78.72 | 86.35 | 1.33 | 9.64 | 24.50 | 25.98 | 44.81 | 41.58 |
| Rondônia | 75.98 | 89.09 | 0.26 | 3.69 | 28.33 | 17.05 | 45.13 | 64.09 |
| Acre | 69.44 | 79.33 | 3.52 | 19.50 | 20.98 | 11.60 | 36.97 | 34.92 |
| Amazonas | 84.11 | 87.23 | 1.12 | 20.00 | 29.01 | 26.99 | 36.53 | 28.12 |
| Roraima | 81.11 | 88.76 | 5.03 | 10.71 | 25.58 | 52.22 | 46.83 | 24.60 |
| Pará | 82.64 | 87.95 | 1.37 | 7.40 | 27.61 | 30.33 | 46.69 | 40.78 |
| Amapá | 87.41 | 93.06 | 5.80 | 6.15 | 8.78 | 18.19 | 57.02 | 47.56 |
| Tocantins | 53.58 | 73.95 | 0.00 | 2.75 | 0.79 | 17.08 | 51.53 | 50.39 |
| Northeast | 62.18 | 76.44 | 8.92 | 25.11 | 15.14 | 12.84 | 31.47 | 33.97 |
| Maranhão | 51.14 | 60.21 | 7.11 | 9.21 | 11.13 | 15.37 | 29.99 | 30.95 |
| Piauí | 41.69 | 57.06 | 1.33 | 4.00 | 21.63 | 35.19 | 18.11 | 16.79 |
| Ceará | 58.53 | 75.47 | 6.36 | 21.44 | 13.69 | 12.44 | 36.64 | 39.42 |
| Rio Grande do Norte | 75.04 | 89.90 | 6.99 | 16.52 | 30.10 | 24.31 | 36.17 | 47.51 |
| Paraíba | 66.26 | 81.27 | 12.61 | 28.90 | 16.20 | 10.05 | 30.27 | 37.02 |
| Pernambuco | 72.90 | 84.61 | 15.65 | 34.25 | 9.32 | 9.58 | 38.42 | 33.86 |
| Alagoas | 65.44 | 80.25 | 7.35 | 15.29 | 7.53 | 10.79 | 46.97 | 49.69 |
| Sergipe | 72.44 | 86.49 | 16.94 | 27.81 | 16.10 | 15.12 | 37.23 | 40.05 |
| Bahia | 60.10 | 75.95 | 6.97 | 34.51 | 17.88 | 7.86 | 23.01 | 28.04 |
| Southeast | 95.54 | 98.29 | 63.55 | 73.42 | 10.58 | 8.92 | 13.07 | 8.86 |
| Minas Gerais | 87.85 | 94.96 | 55.98 | 68.19 | 1.73 | 2.50 | 22.14 | 16.04 |
| Espírito Santo | 90.81 | 97.41 | 42.93 | 56.25 | 10.56 | 10.16 | 22.48 | 18.62 |
| Rio de Janeiro | 97.65 | 99.10 | 45.90 | 62.51 | 27.92 | 21.64 | 6.22 | 4.92 |
| São Paulo | 98.55 | 99.57 | 76.20 | 81.69 | 7.22 | 6.54 | 11.10 | 6.38 |
| South | 93.91 | 97.86 | 13.69 | 29.56 | 39.83 | 34.22 | 35.51 | 28.97 |
| Paraná | 93.85 | 97.90 | 21.52 | 37.66 | 18.17 | 15.38 | 51.25 | 41.12 |
| Santa Catarina | 94.98 | 98.42 | 4.40 | 19.50 | 59.57 | 54.03 | 23.02 | 17.88 |
| Rio Grande do Sul | 93.48 | 97.56 | 11.30 | 27.43 | 49.10 | 40.96 | 27.94 | 23.79 |
| Central-West | 89.51 | 95.68 | 27.28 | 33.27 | 7.57 | 7.52 | 52.90 | 53.09 |
| Mato Grosso do Sul | 93.65 | 97.65 | 8.73 | 11.83 | 2.14 | 6.59 | 81.91 | 77.42 |
| Mato Grosso | 83.56 | 91.73 | 5.50 | 15.66 | 19.66 | 14.10 | 55.74 | 59.75 |
| Goiás | 87.15 | 95.30 | 26.97 | 30.36 | 2.68 | 5.36 | 55.29 | 57.30 |
| Federal District | 98.10 | 99.32 | 75.37 | 83.48 | 11.98 | 6.25 | 10.25 | 9.45 |
Table 48 - Conclusion
Proportion of permanent private households by existence of bathroon or toilet and type of sanitary sewage, according to sanitary sewage, by major Regions and Federation Units - 1991/2000 (conclusion)
| Major Regions and Federation Units | Proportion of permanent private households by existence of bathroon or toilet and type of sanitary sewage (%) | |||||
|---|---|---|---|---|---|---|
| Had either bathroom or toilet | Had neither bathroom nor toilet | |||||
| Type of sanitary sewage | ||||||
| Ditch | Other gully | |||||
| 1991 | 2000 | 1991 | 2000 | 1991 | 2000 | |
| Brazil | 3.39 | 2.58 | 3.51 | 3.30 | 14.71 | 8.27 |
| North | 4.71 | 4.27 | 3.37 | 4.88 | 21.28 | 13.65 |
| Rondônia | 1.71 | 2.18 | 0.56 | 2.08 | 24.02 | 10.91 |
| Acre | 5.29 | 7.59 | 2.69 | 5.72 | 30.56 | 20.67 |
| Amazonas | 11.10 | 4.98 | 6.37 | 7.14 | 15.89 | 12.77 |
| Roraima | 3.19 | 0.73 | 0.47 | 0.50 | 18.89 | 11.24 |
| Pará | 3.30 | 5.03 | 3.68 | 4.41 | 17.36 | 12.05 |
| Amapá | 12.70 | 4.02 | 3.10 | 17.14 | 12.59 | 6.94 |
| Tocantins | 0.70 | 1.34 | 0.57 | 2.40 | 46.42 | 26.05 |
| Northeast | 2.04 | 2.13 | 4.62 | 2.38 | 37.82 | 23.56 |
| Maranhão | 1.85 | 2.89 | 1.06 | 1.80 | 48.86 | 39.79 |
| Piauí | 0.49 | 0.49 | 0.13 | 0.58 | 58.31 | 42.94 |
| Ceará | 0.89 | 0.96 | 0.95 | 1.20 | 41.47 | 24.53 |
| Rio Grande do Norte | 0.56 | 0.68 | 1.21 | 0.89 | 24.96 | 10.10 |
| Paraíba | 2.36 | 2.62 | 4.82 | 2.68 | 33.74 | 18.73 |
| Pernambuco | 2.15 | 2.80 | 7.35 | 4.12 | 27.10 | 15.39 |
| Alagoas | 1.39 | 2.12 | 2.21 | 2.36 | 34.56 | 19.75 |
| Sergipe | 1.47 | 1.55 | 0.70 | 1.95 | 27.56 | 13.51 |
| Bahia | 3.42 | 2.67 | 8.83 | 2.87 | 39.90 | 24.05 |
| Southeast | 4.30 | 2.70 | 4.05 | 4.41 | 4.46 | 1.71 |
| Minas Gerais | 1.98 | 1.57 | 6.03 | 6.67 | 12.15 | 5.04 |
| Espírito Santo | 5.81 | 5.23 | 9.03 | 7.15 | 9.19 | 2.59 |
| Rio de Janeiro | 10.46 | 6.16 | 7.14 | 3.87 | 2.35 | 0.90 |
| São Paulo | 2.60 | 1.59 | 1.43 | 3.37 | 1.45 | 0.43 |
| South | 3.45 | 3.10 | 1.43 | 2.01 | 6.09 | 2.14 |
| Paraná | 2.20 | 1.88 | 0.71 | 1.85 | 6.15 | 2.10 |
| Santa Catarina | 5.35 | 4.17 | 2.64 | 2.84 | 5.02 | 1.58 |
| Rio Grande do Sul | 3.65 | 3.64 | 1.48 | 1.75 | 6.52 | 2.44 |
| Central-West | 1.06 | 0.72 | 0.69 | 1.09 | 10.49 | 4.32 |
| Mato Grosso do Sul | 0.58 | 0.68 | 0.30 | 1.13 | 6.35 | 2.35 |
| Mato Grosso | 2.16 | 1.12 | 0.49 | 1.09 | 16.44 | 8.27 |
| Goiás | 1.01 | 0.82 | 1.20 | 1.45 | 12.85 | 4.70 |
| Federal District | 0.45 | 0.03 | 0.05 | 0.10 | 1.90 | 0.68 |
Table 52
Proportion of permanent private households by waste disposal, according to Major Regions and Federation Units - 1991/2000
| Major Regions and Federation Units | Proportion of permanent private households by waste disposal (%) | |||||||||
|---|---|---|---|---|---|---|---|---|---|---|
| Collected | Burned | Burried | Thrown | Other | ||||||
| 1991 | 2000 | 1991 | 2000 | 1991 | 2000 | 1991 | 2000 | 1991 | 2000 | |
| Brazil | 63.80 | 79.01 | 11.89 | 11.23 | 1.64 | 1.16 | 16.91 | 7.36 | 5.75 | 1.24 |
| North | 36.87 | 57.72 | 28.59 | 26.81 | 2.28 | 1.79 | 26.12 | 12.38 | 6.14 | 1.30 |
| Rondônia | 38.56 | 57.28 | 37.62 | 34.97 | 1.15 | 1.44 | 18.31 | 5.43 | 4.35 | 0.88 |
| Acre | 37.97 | 55.85 | 15.73 | 23.41 | 0.70 | 1.34 | 38.56 | 16.96 | 7.03 | 2.44 |
| Amazonas | 47.77 | 64.74 | 23.15 | 22.99 | 0.65 | 0.89 | 24.44 | 9.97 | 3.99 | 1.41 |
| Roraima | 53.91 | 68.93 | 21.94 | 19.21 | 2.14 | 2.44 | 20.54 | 8.68 | 1.45 | 0.75 |
| Pará | 32.92 | 53.44 | 30.24 | 27.95 | 3.22 | 2.40 | 28.51 | 15.14 | 5.12 | 1.07 |
| Amapá | 58.02 | 71.75 | 15.22 | 15.08 | 0.42 | 0.74 | 25.37 | 11.84 | 0.97 | 0.58 |
| Tocantins | 22.20 | 56.86 | 30.43 | 26.86 | 3.73 | 1.66 | 23.77 | 12.07 | 19.86 | 2.56 |
| Northeast | 41.45 | 60.59 | 6.55 | 14.77 | 1.18 | 1.39 | 38.35 | 20.01 | 12.47 | 3.24 |
| Maranhão | 16.17 | 34.32 | 18.28 | 29.94 | 2.56 | 3.21 | 47.56 | 27.99 | 15.43 | 4.54 |
| Piauí | 23.68 | 43.73 | 11.41 | 23.23 | 1.95 | 1.45 | 41.08 | 19.86 | 21.88 | 11.75 |
| Ceará | 42.82 | 61.48 | 6.09 | 11.18 | 1.57 | 1.61 | 36.06 | 23.28 | 13.47 | 2.45 |
| Rio Grande do Norte | 57.23 | 73.66 | 7.54 | 12.10 | 2.59 | 1.80 | 13.89 | 11.99 | 18.75 | 0.44 |
| Paraíba | 45.38 | 65.91 | 2.70 | 11.32 | 0.43 | 0.74 | 33.23 | 12.76 | 18.26 | 9.26 |
| Pernambuco | 51.80 | 68.65 | 3.24 | 9.20 | 0.28 | 0.53 | 41.38 | 19.10 | 3.30 | 2.52 |
| Alagoas | 46.40 | 68.89 | 2.60 | 9.87 | 0.37 | 0.86 | 47.26 | 19.21 | 3.38 | 1.17 |
| Sergipe | 51.80 | 69.84 | 5.42 | 13.41 | 1.06 | 1.15 | 26.33 | 14.52 | 15.39 | 1.08 |
| Bahia | 41.01 | 61.67 | 5.11 | 15.23 | 0.96 | 1.30 | 39.68 | 20.26 | 13.24 | 1.54 |
| Southeast | 78.59 | 90.32 | 9.91 | 6.60 | 0.79 | 0.43 | 8.01 | 2.25 | 2.70 | 0.40 |
| Minas Gerais | 56.76 | 78.35 | 17.24 | 14.39 | 0.85 | 0.69 | 16.49 | 5.57 | 8.66 | 0.99 |
| Espírito Santo | 55.58 | 77.57 | 17.13 | 15.99 | 1.07 | 0.70 | 15.71 | 5.09 | 10.52 | 0.65 |
| Rio de Janeiro | 77.21 | 92.82 | 12.61 | 5.10 | 0.48 | 0.14 | 9.09 | 1.76 | 0.62 | 0.17 |
| São Paulo | 91.02 | 95.83 | 4.81 | 2.87 | 0.88 | 0.41 | 3.04 | 0.70 | 0.25 | 0.20 |
| South | 67.73 | 83.55 | 16.96 | 11.69 | 4.43 | 2.42 | 6.99 | 1.70 | 3.90 | 0.63 |
| Paraná | 66.74 | 83.22 | 19.31 | 12.49 | 3.12 | 1.96 | 8.84 | 1.85 | 2.00 | 0.49 |
| Santa Catarina | 63.95 | 83.05 | 20.82 | 12.50 | 4.81 | 2.50 | 7.94 | 1.42 | 2.47 | 0.53 |
| Rio Grande do Sul | 70.25 | 84.09 | 13.25 | 10.60 | 5.37 | 2.79 | 5.01 | 1.72 | 6.13 | 0.81 |
| Central-West | 62.87 | 81.71 | 19.93 | 13.13 | 1.80 | 1.64 | 10.73 | 2.80 | 4.67 | 0.72 |
| Mato Grosso do Sul | 68.91 | 80.60 | 22.79 | 14.21 | 2.89 | 2.81 | 4.09 | 1.67 | 1.32 | 0.71 |
| Mato Grosso | 49.77 | 71.68 | 30.17 | 20.58 | 2.20 | 2.64 | 14.95 | 4.31 | 2.92 | 0.79 |
| Goiás | 54.17 | 81.14 | 20.46 | 13.38 | 1.44 | 1.25 | 15.26 | 3.38 | 8.67 | 0.85 |
| Federal District | 94.61 | 96.14 | 2.91 | 2.61 | 0.98 | 0.24 | 1.39 | 0.69 | 0.11 | 0.32 |
Tabela 56
Permanent private households with basic sanitation, in absolute values and values proportionally related to the total permanent private households, according to Major Regions and Federation Units - 1991/2000
| Major Regions and Federation Units | Domicílios particulares permanentes atendidos com saneamento básico | |||
|---|---|---|---|---|
| Absolute | Proportion in relation to the total permanent private households (%) | |||
| 1991 | 2000 | 1991 | 2000 | |
| Brazil | 15 734 094 | 25 296 321 | 45.30 | 56.47 |
| North | 326 158 | 645 758 | 16.69 | 22.98 |
| Rondônia | 36 316 | 31 584 | 14.26 | 9.10 |
| Acre | 13 508 | 21 532 | 15.31 | 16.63 |
| Amazonas | 95 348 | 211 708 | 24.79 | 37.08 |
| Roraima | 9 480 | 40 989 | 23.48 | 55.06 |
| Pará | 164 616 | 280 808 | 17.47 | 21.45 |
| Amapá | 6 509 | 13 390 | 12.29 | 13.58 |
| Tocantins | 381 | 45 747 | 0.20 | 16.32 |
| Northeast | 1 626 786 | 3 684 584 | 18.05 | 32.32 |
| Maranhão | 102 303 | 218 835 | 10.40 | 17.71 |
| Piauí | 83 660 | 201 435 | 16.12 | 30.46 |
| Ceará | 185 661 | 491 767 | 13.80 | 27.97 |
| Rio Grande do Norte | 152 574 | 248 020 | 29.32 | 36.91 |
| Paraíba | 159 606 | 297 932 | 23.02 | 35.08 |
| Pernambuco | 329 864 | 724 364 | 20.79 | 36.79 |
| Alagoas | 63 871 | 141 357 | 12.16 | 21.77 |
| Sergipe | 89 164 | 175 032 | 27.12 | 40.08 |
| Bahia | 460 083 | 1 185 842 | 18.32 | 37.40 |
| Southeast | 10 563 833 | 15 689 277 | 66.77 | 77.58 |
| Minas Gerais | 1 771 987 | 3 163 959 | 47.80 | 66.40 |
| Espírito Santo | 264 067 | 514 069 | 42.69 | 61.12 |
| Rio de Janeiro | 2 147 246 | 3 124 889 | 62.15 | 73.46 |
| São Paulo | 6 380 533 | 8 886 360 | 79.36 | 85.74 |
| South | 2 546 651 | 4 104 385 | 44.72 | 56.97 |
| Paraná | 744 242 | 1 331 761 | 35.72 | 49.99 |
| Santa Catarina | 512 431 | 914 849 | 45.69 | 61.04 |
| Rio Grande do Sul | 1 289 978 | 1 857 775 | 51.82 | 61.07 |
| Centro-Oeste | 670 666 | 1 172 317 | 29.79 | 37.16 |
| Mato Grosso do Sul | 43 196 | 92 400 | 10.05 | 16.41 |
| Mato Grosso | 85 298 | 159 944 | 18.71 | 24.76 |
| Goiás | 240 708 | 445 207 | 24.36 | 31.85 |
| Federal District | 301 464 | 474 766 | 79.82 | 86.69 |
Source: IBGE. Censo Demográfico 1991/2000.
Note: data refer to permanent private households served by public water supply system, with a bathroom or a toilet, with rainwater drainage or septic tank for sanitary sewage and waste collection.
Complete tables (zip)
Brazil
- Population 1,110100
- Population 1,11020
- Population 1,110200
- Population 1,11030
- Population 1,11040
- Population 1,11050
- Population 1,11060
- Population 1,12010
- Population 1,12020
- Population 1,12030
- Population 1,12040
- Population 1,12050
- Population 1,13010
- Population 1,13020
- Population 1,13030
- Population 1,13040
- Population 1,13050
- Population 1,13060
- Population 1,13070
- Population 1,13080
- Population 1,13090
- Population 1,13100
- Population 1,13110
- Population 1,13120
Major Regions
- Population 1,2101
- Population 1,2102
- Population 1,2103
- Population 1,2104
- Population 1,2105
- Population 1,2106
- Population 1,2107
- Population 1,2108
- Population 1,2109
- Population 1,2201
- Population 1,2202
- Population 1,2203
- Population 1,2204
- Population 1,2205
- Population 1,2301
- Population 1,2302
- Population 1,2303
- Population 1,2304
- Population 1,2305
- Population 1,2306
- Population 1,2307
- Population 1,2308
- Population 1,2309
- Population 1,2310
- Population 1,2311
- Population 1,2312
Municipalities
- Population 11,31
- Population 11,33
- Population 12,31
- Population 12,33
- Population 13,31
- Population 13,33
- Population 14,31
- Population 14,33
- Population 15,31
- Population 15,33
- Population 16,31
- Population 16,33
- Population 17,31
- Population 17,33
- Population 21,31
- Population 21,33
- Population 22,31
- Population 22,33
- Population 23,31
- Population 23,33
- Population 24,31
- Population 24,33
- Population 25,31
- Population 25,33
- Population 26,31
- Population 26,33
- Population 27,31
- Population 27,33
- Population 28,31
- Population 28,33
- Population 29,31
- Population 29,33
- Population 31,31
- Population 31,33
- Population 32,31
- Population 32,33
- Population 33,31
- Population 33,33
- Population 35,31
- Population 35,33
- Population 41,31
- Population 41,33
- Population 42,31
- Population 42,33
- Population 43,31
- Population 43,33
- Population 50,31
- Population 50,33
- Population 51,31
- Population 51,33
- Population 52,31
- Population 52,33
- Population 53,31
- Population 53,33
Table 23
Literacy and illiteracy rate of persons aged 15 and above, by sex and by rural or urban area, according to age groups - 1980/2000
| Age Groups | Literacy and illiteracy rate of persons aged 15 and above (%) | ||||||||||||||
|---|---|---|---|---|---|---|---|---|---|---|---|---|---|---|---|
| Total | Men | Women | Urban | Rural | |||||||||||
| 1980 | 1991 | 2000 | 1980 | 1991 | 2000 | 1980 | 1991 | 2000 | 1980 | 1991 | 2000 | 1980 | 1991 | 2000 | |
| Literacy Rate | |||||||||||||||
| Total | 74.59 | 79.93 | 86.37 | 76.38 | 80.15 | 86.23 | 72.85 | 79.72 | 86.50 | 83.20 | 85.81 | 89.75 | 53.79 | 59.47 | 70.21 |
| 15 to 19 years old | 83.53 | 87.95 | 95.00 | 81.23 | 84.89 | 93.54 | 85.77 | 90.96 | 96.48 | 91.56 | 93.22 | 96.77 | 66.48 | 72.70 | 87.81 |
| 20 to 24 years old | 84.37 | 87.82 | 93.27 | 84.12 | 86.07 | 91.66 | 84.60 | 89.54 | 94.88 | 91.42 | 92.69 | 95.64 | 66.27 | 71.24 | 81.93 |
| 25 to 29 years old | 82.00 | 87.30 | 91.98 | 82.87 | 86.03 | 90.34 | 81.16 | 88.52 | 93.57 | 89.61 | 92.09 | 94.67 | 61.50 | 69.25 | 78.31 |
| 30 to 34 years old | 78.09 | 86.04 | 90.31 | 79.72 | 85.54 | 88.88 | 76.49 | 86.51 | 91.67 | 86.61 | 91.03 | 93.30 | 55.78 | 66.09 | 74.79 |
| 35 to 39 years old | 73.45 | 83.06 | 89.22 | 76.20 | 83.52 | 88.12 | 70.79 | 82.62 | 90.27 | 82.94 | 88.65 | 92.39 | 50.71 | 60.68 | 72.30 |
| 40 to 44 years old | 70.38 | 78.17 | 87.56 | 73.83 | 79.35 | 87.24 | 66.94 | 77.02 | 87.87 | 80.14 | 84.86 | 91.04 | 47.29 | 53.16 | 68.58 |
| 45 to 49 years old | 67.79 | 73.76 | 84.33 | 72.15 | 75.55 | 84.80 | 63.52 | 72.04 | 83.89 | 77.49 | 81.07 | 88.47 | 44.22 | 48.52 | 62.94 |
| 50 to 54 years old | 64.62 | 70.11 | 79.67 | 69.34 | 72.74 | 80.75 | 59.99 | 67.60 | 78.65 | 74.36 | 77.58 | 84.55 | 40.82 | 45.24 | 56.47 |
| 55 to 59 years old | 60.31 | 66.66 | 74.48 | 65.57 | 70.33 | 76.49 | 55.12 | 63.34 | 72.67 | 70.11 | 74.01 | 80.04 | 37.01 | 42.05 | 51.39 |
| 60 to 64 years old | 55.43 | 62.74 | 70.85 | 61.55 | 66.51 | 73.26 | 49.65 | 59.36 | 68.73 | 65.28 | 70.04 | 76.26 | 32.69 | 38.08 | 48.26 |
| 65 years old ou mais | 46.20 | 52.20 | 62.02 | 52.57 | 56.15 | 64.94 | 40.62 | 48.91 | 59.72 | 55.84 | 59.75 | 67.32 | 24.30 | 27.71 | 38.43 |
| Illiteracy Rate | |||||||||||||||
| Total | 25.41 | 20.07 | 13.63 | 23.62 | 19.85 | 13.77 | 27.15 | 20.28 | 13.50 | 16.80 | 14.19 | 10.25 | 46.21 | 40.53 | 29.79 |
| 15 to 19 years old | 16.47 | 12.05 | 5.00 | 18.77 | 15.11 | 6.46 | 14.23 | 9.04 | 3.52 | 8.44 | 6.78 | 3.23 | 33.52 | 27.30 | 12.19 |
| 20 to 24 years old | 15.63 | 12.18 | 6.73 | 15.88 | 13.93 | 8.34 | 15.40 | 10.46 | 5.12 | 8.58 | 7.31 | 4.36 | 33.73 | 28.76 | 18.07 |
| 25 to 29 years old | 18.00 | 12.70 | 8.02 | 17.13 | 13.97 | 9.66 | 18.84 | 11.48 | 6.43 | 10.39 | 7.91 | 5.33 | 38.50 | 30.75 | 21.69 |
| 30 to 34 years old | 21.91 | 13.96 | 9.69 | 20.28 | 14.46 | 11.12 | 23.51 | 13.49 | 8.33 | 13.39 | 8.97 | 6.70 | 44.22 | 33.91 | 25.21 |
| 35 to 39 years old | 26.55 | 16.94 | 10.78 | 23.80 | 16.48 | 11.88 | 29.21 | 17.38 | 9.73 | 17.06 | 11.35 | 7.61 | 49.29 | 39.32 | 27.70 |
| 40 to 44 years old | 29.62 | 21.83 | 12.44 | 26.17 | 20.65 | 12.76 | 33.06 | 22.98 | 12.13 | 19.86 | 15.14 | 8.96 | 52.71 | 46.84 | 31.42 |
| 45 to 49 years old | 32.21 | 26.24 | 15.67 | 27.85 | 24.45 | 15.20 | 36.48 | 27.96 | 16.11 | 22.51 | 18.93 | 11.53 | 55.78 | 51.48 | 37.06 |
| 50 to 54 years old | 35.38 | 29.89 | 20.33 | 30.66 | 27.26 | 19.25 | 40.01 | 32.40 | 21.35 | 25.64 | 22.42 | 15.45 | 59.18 | 54.76 | 43.53 |
| 55 to 59 years old | 39.69 | 33.34 | 25.52 | 34.43 | 29.67 | 23.51 | 44.88 | 36.66 | 27.33 | 29.89 | 25.99 | 19.96 | 62.99 | 57.95 | 48.61 |
| 60 to 64 years old | 44.57 | 37.26 | 29.15 | 38.45 | 33.49 | 26.74 | 50.35 | 40.64 | 31.27 | 34.72 | 29.96 | 23.74 | 67.31 | 61.92 | 51.74 |
| 65 years old and above | 53.80 | 47.80 | 37.98 | 47.43 | 43.85 | 35.06 | 59.38 | 51.09 | 40.28 | 44.16 | 40.25 | 32.68 | 75.70 | 72.29 | 61.57 |
Table 30
Value and change of average real monthly income of persons aged 10 years and above, with income, head of permanent private households, by urban or rural area, according to Major Regions and Federation Units - 1991/2000
| Major Regions and Federation Units | Value and change of average real monthly income of persons aged 10 years and above, with income, head of permanent private households, by urban or rural area (R$) | Change (%) | |||||||
|---|---|---|---|---|---|---|---|---|---|
| Total | Urban | Rural | Total | Urban | Rural | ||||
| 1991 | 2000 | 1991 | 2000 | 1991 | 2000 | ||||
| Brazil | 542 | 769 | 633 | 854 | 215 | 328 | 41.88 | 34.91 | 52.56 |
| North | 428 | 577 | 534 | 663 | 263 | 335 | 34.81 | 24.16 | 27.38 |
| Rondônia | 400 | 662 | 513 | 755 | 222 | 475 | 65.50 | 47.17 | 113.96 |
| Acre | 394 | 526 | 487 | 614 | 213 | 294 | 33.50 | 26.08 | 38.03 |
| Amazonas | 544 | 627 | 641 | 715 | 248 | 236 | 15.26 | 11.54 | -4.84 |
| Roraima | 627 | 685 | 702 | 755 | 325 | 332 | 9.25 | 7.55 | 2.15 |
| Pará | 400 | 536 | 494 | 625 | 289 | 328 | 34.00 | 26.52 | 13.49 |
| Amapá | 550 | 683 | 596 | 722 | 342 | 299 | 24.18 | 21.14 | -12.57 |
| Tocantins | 339 | 520 | 446 | 585 | 187 | 306 | 53.39 | 31.17 | 63.64 |
| Northeast | 301 | 448 | 396 | 549 | 143 | 186 | 48.84 | 38.64 | 30.07 |
| Maranhão | 227 | 343 | 265 | 441 | 201 | 187 | 51.10 | 66.42 | -6.97 |
| Piauí | 236 | 363 | 343 | 470 | 108 | 160 | 53.81 | 37.03 | 48.15 |
| Ceará | 289 | 448 | 376 | 545 | 113 | 167 | 55.02 | 44.95 | 47.79 |
| Rio Grande do Norte | 322 | 513 | 394 | 595 | 144 | 233 | 59.32 | 51.02 | 61.81 |
| Paraíba | 260 | 423 | 335 | 507 | 114 | 181 | 62.69 | 51.34 | 58.77 |
| Pernambuco | 362 | 517 | 445 | 597 | 141 | 199 | 42.82 | 34.16 | 41.13 |
| Alagoas | 300 | 454 | 394 | 552 | 154 | 195 | 51.33 | 40.10 | 26.62 |
| Sergipe | 330 | 462 | 413 | 564 | 148 | 183 | 40.00 | 36.56 | 23.65 |
| Bahia | 318 | 460 | 434 | 574 | 137 | 190 | 44.65 | 32.26 | 38.69 |
| Southeast | 690 | 945 | 741 | 993 | 262 | 428 | 36.96 | 34.01 | 63.36 |
| Minas Gerais | 444 | 681 | 519 | 746 | 199 | 345 | 53.38 | 43.74 | 73.37 |
| Espírito Santo | 457 | 722 | 531 | 799 | 222 | 395 | 57.99 | 50.47 | 77.93 |
| Rio de Janeiro | 661 | 970 | 681 | 992 | 224 | 395 | 46.75 | 45.67 | 76.34 |
| São Paulo | 836 | 1 076 | 867 | 1 110 | 388 | 549 | 28.71 | 28.03 | 41.49 |
| South | 530 | 796 | 608 | 868 | 283 | 463 | 50.19 | 42.76 | 63.60 |
| Paraná | 521 | 782 | 608 | 855 | 253 | 422 | 50.10 | 40.63 | 66.80 |
| Santa Catarina | 526 | 814 | 604 | 882 | 319 | 538 | 54.75 | 46.03 | 68.65 |
| Rio Grande do Sul | 540 | 800 | 609 | 873 | 290 | 457 | 48.15 | 43.35 | 57.59 |
| Central-West | 589 | 856 | 654 | 904 | 295 | 518 | 45.33 | 38.23 | 75.59 |
| Mato Grosso do Sul | 519 | 731 | 574 | 778 | 297 | 468 | 40.85 | 35.54 | 57.58 |
| Mato Grosso | 495 | 775 | 561 | 831 | 298 | 530 | 56.57 | 48.13 | 77.85 |
| Goiás | 481 | 689 | 531 | 718 | 270 | 477 | 43.24 | 35.22 | 76.67 |
| Federal District | 1 056 | 1 499 | 1 085 | 1 522 | 514 | 946 | 41.95 | 40.28 | 84.05 |
Table 40
Proportion of permanent private households, by occupation status, according to Major Regions and Federation Units - 1980/2000
| Major Regions and Federation Units | Proportion of permanent private households, by occupation status (%) | |||||||||||
|---|---|---|---|---|---|---|---|---|---|---|---|---|
| Own | Rented | Lent | Other | |||||||||
| 1980 | 1991 | 2000 | 1980 | 1991 | 2000 | 1980 | 1991 | 2000 | 1980 | 1991 | 2000 | |
| Brazil | 61.67 | 69.85 | 74.35 | 22.53 | 16.38 | 14.29 | 14.38 | 13.09 | 10.12 | 1.41 | 0.68 | 1.24 |
| North | 76.29 | 78.37 | 80.33 | 12.75 | 9.77 | 8.80 | 9.20 | 11.23 | 9.63 | 1.76 | 0.63 | 1.24 |
| Rondônia | 64.59 | 67.05 | 75.22 | 14.30 | 12.45 | 10.27 | 18.31 | 19.12 | 13.42 | 2.80 | 1.39 | 1.09 |
| Acre | 80.36 | 83.29 | 83.90 | 8.46 | 7.34 | 6.51 | 8.57 | 8.77 | 8.67 | 2.60 | 0.60 | 0.92 |
| Amazonas | 79.15 | 84.45 | 83.47 | 13.99 | 9.65 | 8.56 | 4.25 | 5.29 | 6.98 | 2.60 | 0.61 | 0.99 |
| Roraima | 72.16 | 73.69 | 77.69 | 17.42 | 13.71 | 10.83 | 9.51 | 11.99 | 10.38 | 0.92 | 0.61 | 1.11 |
| Pará | 77.01 | 79.64 | 81.73 | 13.36 | 9.23 | 7.78 | 8.29 | 10.69 | 9.05 | 1.34 | 0.45 | 1.43 |
| Amapá | 77.79 | 81.99 | 81.43 | 12.92 | 9.26 | 9.10 | 8.56 | 8.24 | 7.76 | 0.73 | 0.51 | 1.70 |
| Tocantins | 74.43 | 72.63 | 72.44 | 7.96 | 9.59 | 12.65 | 16.32 | 17.14 | 13.89 | 1.29 | 0.63 | 1.02 |
| Northeast | 69.58 | 75.60 | 78.30 | 14.88 | 11.21 | 10.60 | 13.96 | 12.53 | 9.93 | 1.57 | 0.67 | 1.17 |
| Maranhão | 88.19 | 86.21 | 83.50 | 5.75 | 5.99 | 6.14 | 5.24 | 7.50 | 8.84 | 0.83 | 0.30 | 1.52 |
| Piauí | 81.57 | 79.07 | 79.64 | 8.72 | 7.76 | 7.14 | 9.10 | 12.63 | 11.69 | 0.61 | 0.55 | 1.52 |
| Ceará | 62.50 | 69.60 | 74.69 | 16.09 | 13.51 | 12.04 | 19.72 | 15.83 | 11.79 | 1.69 | 1.06 | 1.48 |
| Rio Grande do Norte | 65.60 | 72.75 | 76.67 | 16.93 | 12.72 | 12.22 | 16.24 | 13.76 | 10.21 | 1.24 | 0.77 | 0.90 |
| Paraíba | 62.65 | 71.06 | 75.49 | 16.47 | 12.53 | 12.09 | 18.63 | 15.50 | 11.44 | 2.25 | 0.91 | 0.98 |
| Pernambuco | 61.74 | 73.04 | 76.83 | 21.98 | 13.93 | 12.85 | 14.24 | 12.37 | 9.08 | 2.03 | 0.66 | 1.24 |
| Alagoas | 58.48 | 66.70 | 72.89 | 16.68 | 13.33 | 13.12 | 23.70 | 19.29 | 13.19 | 1.14 | 0.69 | 0.80 |
| Sergipe | 76.92 | 78.87 | 79.10 | 14.68 | 12.04 | 11.71 | 7.75 | 8.68 | 8.05 | 0.66 | 0.41 | 1.14 |
| Bahia | 72.74 | 78.83 | 81.02 | 13.30 | 9.77 | 9.44 | 12.18 | 10.83 | 8.60 | 1.78 | 0.57 | 0.93 |
| Southeast | 55.47 | 65.80 | 71.68 | 29.25 | 20.82 | 17.06 | 14.01 | 12.77 | 9.87 | 1.27 | 0.61 | 1.39 |
| Minas Gerais | 60.54 | 68.20 | 72.99 | 20.61 | 15.84 | 14.96 | 17.55 | 15.35 | 11.42 | 1.30 | 0.60 | 0.63 |
| Espírito Santo | 58.00 | 66.06 | 71.25 | 17.83 | 13.32 | 14.04 | 23.54 | 20.12 | 14.13 | 0.63 | 0.49 | 0.58 |
| Rio de Janeiro | 56.03 | 67.65 | 74.56 | 31.68 | 22.38 | 16.94 | 10.63 | 9.26 | 6.96 | 1.66 | 0.70 | 1.55 |
| São Paulo | 52.61 | 63.88 | 69.93 | 33.05 | 23.03 | 18.31 | 13.22 | 12.51 | 10.01 | 1.11 | 0.58 | 1.74 |
| South | 64.93 | 71.47 | 76.61 | 18.67 | 14.18 | 13.18 | 15.03 | 13.42 | 9.30 | 1.36 | 0.94 | 0.92 |
| Paraná | 55.65 | 66.10 | 73.11 | 20.40 | 15.25 | 14.21 | 22.03 | 17.76 | 11.63 | 1.92 | 0.89 | 1.05 |
| Santa Catarina | 73.75 | 76.32 | 79.44 | 14.07 | 11.44 | 12.54 | 11.22 | 11.30 | 7.57 | 0.96 | 0.94 | 0.45 |
| Rio Grande do Sul | 69.42 | 73.77 | 78.27 | 19.06 | 14.52 | 12.59 | 10.48 | 10.74 | 8.10 | 1.04 | 0.97 | 1.04 |
| Central-West | 53.29 | 63.80 | 66.71 | 23.06 | 17.17 | 17.39 | 21.90 | 18.37 | 14.69 | 1.75 | 0.67 | 1.20 |
| Mato Grosso do Sul | 47.52 | 62.03 | 67.24 | 23.91 | 16.82 | 15.29 | 26.98 | 20.38 | 16.51 | 1.59 | 0.78 | 0.96 |
| Mato Grosso | 61.43 | 67.97 | 71.21 | 14.90 | 12.94 | 13.67 | 21.32 | 18.39 | 13.95 | 2.35 | 0.70 | 1.17 |
| Goiás | 55.73 | 64.16 | 67.25 | 21.83 | 16.98 | 17.56 | 21.00 | 18.21 | 14.39 | 1.45 | 0.65 | 0.79 |
| Federal District | 46.36 | 59.85 | 59.48 | 32.39 | 23.17 | 23.51 | 19.06 | 16.47 | 14.46 | 2.19 | 0.52 | 2.54 |
Table 1
Average geometric annual growth rate of the resident population, according to the Major Regions and Federation Units - 1950/2000
| Major Regions and Federation Units | Average geometric annual growth rate of the resident population (%) | ||||
|---|---|---|---|---|---|
| 1950/1960 (1) | 1960/1970 | 1970/1980 | 1980/1991 | 1991/2000 | |
| Brazil | 2.99 | 2.89 | 2.48 | 1.93 | 1.64 |
| North | 3.34 | 3.47 | 5.02 | 3.85 | 2.86 |
| Rondônia | 6.39 | 4.76 | 16.03 | 7.89 | 2.24 |
| Acre | 3.20 | 3.13 | 3.42 | 3.01 | 3.29 |
| Amazonas | 3.33 | 3.03 | 4.12 | 3.57 | 3.31 |
| Roraima | 4.65 | 3.75 | 6.83 | 9.63 | 4.58 |
| Pará | 3.11 | 3.55 | 4.62 | 3.46 | 2.54 |
| Amapá | 6.14 | 5.37 | 4.36 | 4.67 | 5.77 |
| Tocantins | - | - | - | 2.01 | 2.61 |
| Northeast | 2.08 | 2.40 | 2.16 | 1.83 | 1.31 |
| Maranhão | 4.50 | 1.94 | 2.93 | 1.93 | 1.54 |
| Piauí | 1.69 | 3.07 | 2.44 | 1.73 | 1.09 |
| Ceará | 2.96 | 2.84 | 1.95 | 1.70 | 1.75 |
| Rio Grande do Norte | 1.65 | 3.07 | 2.05 | 2.22 | 1.58 |
| Paraíba | 1.52 | 1.76 | 1.52 | 1.32 | 0.82 |
| Pernambuco | 1.86 | 2.34 | 1.76 | 1.36 | 1.19 |
| Alagoas | 1.38 | 2.36 | 2.24 | 2.18 | 1.31 |
| Fernando de Noronha | 8.12 | 1.12 | 0.30 | (2) ... | (2) ... |
| Sergipe | 1.54 | 1.82 | 2.38 | 2.47 | 2.03 |
| Bahia | 2.01 | 2.38 | 2.35 | 2.09 | 1.09 |
| Southeast | 3.06 | 2.67 | 2.64 | 1.77 | 1.62 |
| Minas Gerais | 2.33 | 1.49 | 1.54 | 1.49 | 1.44 |
| Espírito Santo | 3.51 | 2.11 | 2.38 | 2.31 | 1.98 |
| Rio de Janeiro | 3.46 | 3.13 | 2.30 | 1.15 | 1.32 |
| São Paulo | 3.39 | 3.33 | 3.49 | 2.13 | 1.80 |
| South | 4.07 | 3.45 | 1.44 | 1.38 | 1.43 |
| Paraná | 7.16 | 4.97 | 0.97 | 0.93 | 1.40 |
| Santa Catarina | 3.04 | 3.20 | 2.26 | 2.06 | 1.87 |
| Rio Grande do Sul | 2.54 | 2.19 | 1.55 | 1.48 | 1.23 |
| Central-West | 5.36 | 5.60 | 4.05 | 3.01 | 2.39 |
| Mato Grosso do Sul | 6.23 | 5.59 | 3.21 | 2.41 | 1.75 |
| Mato Grosso | 4.29 | 6.12 | 6.64 | 5.38 | 2.40 |
| Goiás | 4.62 | 4.38 | 2.76 | 2.33 | 2.49 |
| Federal District | - | 14.39 | 8.15 | 2.84 | 2.82 |
Source: IBGE, Censo Demográfico 1950/2000.
Note: To compute the growth rate in the 1980-1991 and 1991-2000 periods, the populations have been matched according to the territorial mesh in force in the subsequent census.
(1) To compute the rates, the present population related to 1950 and the resident population related to 1960 have been used. (2) As of 1989, it comprises the State District of the State of Pernambuco.
The IBGE adopts a review policy of the data disclosed by this statistical operation. Data review means any and all scheduled revision of numerical data due to new information, which was not accessible at the time of the first disclosure. For instance: late data that replaces a non-response; or data corrected by the informant himself; or a set of data that has undergone editing and imputation. For more detailed information about the published data review policy of the IBGE statistical operations, check the list of short-term, long-term and special surveys carried out by the Institute with their respective revision procedure on: https://biblioteca.ibge.gov.br/index.php/biblioteca-catalogo?view=detalhes&id=298009.
Publications - Demographic trends: an analysis of universe results
Description
It is the major reference source to know the life conditions of the population in all the municipalities of Brazil and in their internal territorial divisions, having the resident person in the housing unit in the National Territory in the reference date as the data collection unit.
The Basic Questionnaire of the survey investigates information on the characteristics of the housing units (urban or rural status, number of bathrooms, existence of toilet, drainage of the bathroom or toilet, water supply, garbage disposal, existence of electricity, etc.); international emigration; composition of the housing units (number of residents, shared responsibility, list of residents, identification of the head, family relationship with the head of the household, etc.); characteristics of residents (sex and age, color or race, ethnicity and spoken language, in the case of Indians, ownership of birth registration, literacy, monthly earnings, etc.); and mortality. Selected housing units were investigated through the Sample Questionnaire, which includes more detailed items on the characteristics of the housing unit and residents in addition to those present in the Basic Questionnaire, as well as items on specific themes like disability, nuptiality and fertility.
The periodicity of the survey is decennial, except for the years of 1910 and 1930, in which the survey was canceled, and of 1990, whose operation was postponed to 1991.
The geographic coverage is nationwide, with results released for Brazil, Major Regions, Federation Units, Mesoregions, Microregions, Metropolitan Areas, Municipalities, Districts, Sub-districts and Enumeration Areas.
Historical Overview
The first population census in Brazil was carried out in 1808, specifically aiming at military interests of recruiting for the Armed Forces. It caused the suspect that its results would have been far from reality, due either to the natural prevention of the population against census operations or, mainly, to its objectives. For historical purposes, the census carried out in 1872, called General Census of the Empire, is considered the first one in Brazil, due to its bigger complexity and, above all, to the control exerted on the whole operation. It was established by Decree no. 4,856, of December 30, 1871, and conducted by the General Directorate of Statistics, later discontinued in 1879. The census scheduled for 1880 was transferred to 1887, eventually remaining just as a project. The General Directorate of Statistics was reestablished by Decree no. 113-d, of January 2, 1890, which set the date of December 31, 1890 to carry out the I Census of the Republic. The II Decennial Census of the Republic began on December 31, 1900 in the entire Brazilian territory. Nevertheless, problems with the calculation of the data in the city of Rio de Janeiro, then Federal District, caused the appointment of a commission to study this issue, which concluded to cancel the results related to the city. Based on a legal provision towards this aim, the Federal District carried out another survey just in 1906, completed in February 1907 and released in a special volume. Scheduled for December 31, 1910, the III Decennial Census of the Republic was transferred to June 30, 1911. The operation was definitively discontinued as a result of the political turmoil that Brazil was facing at the time. Carried out on September 1, 1920, the IV Decennial Census aimed at not only the population, yet also the economic situation of the localities. As a result, the industrial and agricultural production in Brazil were thoroughly investigated. Considering the decennial periodicity of the Brazilian censuses as established by law, the V General Census of Brazil should had taken place in 1930, yet a number of reasons, particularly those of political nature, hindered the operation that year. After the radical transformation of the statistical services in Brazil – creation of the National Council of Statistics - CNE and National Council of Geography - CNG, which, altogether, formed the IBGE, according to Decree-Law no. 218, of January 26, 1938 –, the V General Census of Brazil was carried out in 1940, corresponding to the fifth population census, second agricultural and industrial census, and first surveying on trade, transportation, communications and services. Carried out in 1950, the VI General Census of Brazil included the Population Census, whose reference date was fixed on July 1st, and the Agricultural, Industrial, Trade and Services Censuses, as well as the special surveys on transportation and communications. That census integrated the Census of the Americas, sponsored by the Inter-American Statistical Institute - IASI, addressing a specific request from the United Nations - UN. Held on September 1, 1960, the VII General Census of Brazil also followed the basic guidelines established by those international organizations, in order to assure the consistency of the concepts and allow the comparability of the census results among the American nations. In this survey, the sampling technique was used for the first time in a Brazilian census. Integrated with the Census of the Americas, the VIII General Census of Brazil was carried out on September 1, 1970, encompassing the Population Census and the Property, Agricultural, Industrial, Trade and Services Censuses, as well as special surveys on credit institutions, insurance companies and companies in charge of producing and distributing electricity. The IBGE carried out the IX General Census of Brazil on September 1, 1980, which included not only the Population Census, yet also the Agricultural, Industrial, Trade and Services Censuses and, after previous surveys, integrated with the Census of the Americas, as suggested by the UN. That survey counted on technological advances that allowed innovations in the operation and dissemination of results, which were published in the same year of the operation for the first time ever. Due to budget restrictions, the Population Census was not carried out in 1990, being postponed to September 1, 1991. Compared with the previous censuses, the 1991 Population Census innovated in a number of technical, technological and operational aspects, highlighting also the institution of partnerships – Municipal Census Commissions - CCMs and the Advisory Commission –, which worked as a link between the IBGE and the society. The 2000 Population Census, which resumed the operation in years ending in zero, anticipated the reference date of the survey from September 1st to August 1st, and represented a qualitative leap in a number of aspects, particularly concerning the technological innovation – from the system that followed up the data collection to the data capture and to the automation of the processes of data coding, edit and tabulation, through the extensive use of digital technologies, providing the most appropriate media to each segment of users. Its implementation consolidated the statistical bonds among the countries of the Extended Mercosur, which also includes Argentina, Paraguay, Uruguay, Bolivia and Chile. Carried out on August 1st, the 2010 Population Census made important transformations in the work methods, providing users with even more interactive and specialized pictures, characterized by relevant methodological improvements and technological advances. Partnerships were improved and strengthened through the State Census Commissions - CCEs and Municipal Commissions of Geography and Statistics - CMGEs, aiming at expanding the integration between the IBGE and the local communities to gather cooperation and logistics support for the implementation of institutional surveys.
Time series
#tabelasidra2018731246098
#seriehistorica20187312484678
#seriehistorica201873125221541
#seriehistorica20187312541828
...
Microdata
The microdata are the lowest level of disaggregation of the data of a survey, representing, in the form of numerical codes, the content of the questionnaires and preserving the statistical confidentiality aiming at the non-individualization of the information. The microdata are in ASCII format, allowing expert users with knowledge in programming, preferably in statistical software, to read the data, cross them in different geographic aggregations and create multiple tabulations according to their personal interest.
The microdata files are coupled with a support documentation that provides the names, codes and descriptions of the variables and their categories, complemented, whenever needed, with elements to compute the sampling errors.
2010 Census
Updating
March 11, 2016 - Variable v1005 - ENUMERATION AREA STATUS was included in the HOUSING UNIT, PERSON, EMIGRATION and MORTALITY files
Federation Units
Tables - Federation Units and Municipalities (in zip format)
- Rondônia
- Acre
- Amazonas
- Roraima
- Pará
- Amapá
- Tocantins
- Maranhão
- Piauí
- Ceará
- Rio Grande do Norte
- Paraíba
- Pernambuco
- Alagoas
- Sergipe
- Bahia
- Minas Gerais
- Espírito Santo
- Rio de Janeiro
- São Paulo - except MA
- São Paulo - MA
- Paraná
- Santa Catarina
- Rio Grande do Sul
- Mato Grosso do Sul
- Mato Grosso
- Goiás
- Federal District
- Microdata for the 14 municipalities with redesigned areas
- updated on March 31, 2016 - variable v1005 - ENUMERATION AREA STATUS was included in the Variable description files - Microdata of the sample of the 2010 Population Census - updated on March 15, 2016
- variable v1005 - ENUMERATION AREA STATUS was included in the Layout_microdados_Amostra_14_munic_20160301 file, in the sub-folders of HOUSING UNIT, PERSON, EMIGRATION and MORTALITY
2000 Census
Updating
September 8, 2017 - It was detected that variable V0300 was not in the housing unit file.
March 9, 2016 - It was detected that the activity and employment files were incomplete and that it was necessary to include new codes in the documentation that matches the codes of 2000 and 1991.
June 19, 2015 - It was detected that parts of some records were corrupted. The files were replaced.
Federation Units
Downloads
Technical Information
Methodology of the survey carried out in 2010 (Methodological Reports Series, v. 41)
Methodology of the survey carried out in 2000 (Methodological Reports Series, v. 25)
Methodology of the survey carried out in 1980 (Methodological Reports Series, v. 4)
The changes that took place in the survey after the release of the methodological reports are presented either as Technical notes and/or Methodological notes. The technical notes either report or clarify specific issues on the survey, whereas the methodological notes address general aspects of the improvements, updates and/or revisions implemented, as well as complementary methodological aspects, whose clarifications have been made necessary before the release of a new formal volume of the Methodological Reports Series.
Technical notes
- Technical note 01/2018 - Reinterpretation of the data on disabled persons in the 2010 Population Census, in the light of the recommendations of the Washington Group
News and Releases
2022 Census
2022 Census: two out of three Brazilians were residents of roads without wheelchair ramps
Data found in the 2022 Census show that, of the 174.2 million residents of areas with urban characteristics...
17/04/2025
2022 Census
In Maceió (AL), IBGE releases urban characteristics of surroundings of housing units
On April 17, at 10 am, in Maceió (AL), the Brazilian Institute of Geography and Statistics (IBGE) will...
03/04/2025
2022 Census
2022 Census: proportion of population with complete higher education increases from 6.8% in 2000 to 18.4% in 2022
Between 2000 and 2022, the proportion of persons with complete higher education grew 2.7 times in the...
26/02/2025

2022 Census
2022 Census: Brazil has 8.5 thousand Indigenous localities, most of them in the North Region
According with Census data, published today (19) by the IBGE, there were 8,568 Indigenous localities...
19/12/2024

2022 Census
2022 Census: one out of five Brazilians lives in rented household
In 2022, the proportion of Brazilians who lived in rented households maintained the upward trend and...
12/12/2024

2022 Census
2022 Census: At Casa Brasil IBGE, technical team releases aggregated results by enumeration areas and enumeration routes
The Brazilian Institute of Geography and Statistics (IBGE) released, on Thursday, 14, data relative to...
14/11/2024
2022 Census
2022 Census: 87% of the Brazilian population lives in urban areas
According to the 2022 Population Census, of the total country's population, 203.1 million people, 177.5...
14/11/2024

2022 Census
IBGE launches Environment and Maps Modules for the Creating Synergies between the 2030 Agenda and the G20 series
The Brazilian Institute of Geography and Statistics (IBGE) is releasing the Environment and Maps thematic...
14/11/2024

2022 Census
2022 Census: IBGE releases data on the Census Map at Casa Brasil IBGE
On November 14, at 10 am, the Brazilian Institute of Geography and Statistics (IBGE) will releases the...
12/11/2024

2022 Census
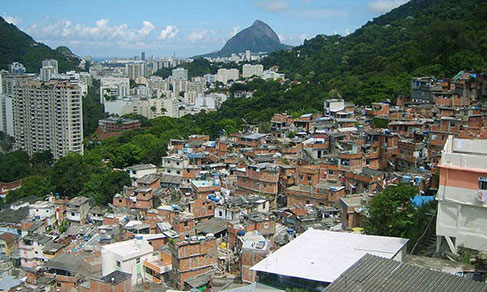
2022 Census: 16.4 million persons in Brazil lived in Favelas and Urban Communities
The 2022 Population Census found 12,348 Favelas and Urban Communities in Brazil, inhabited by 16,390,815...
08/11/2024
Errata
Correction of files in the product Aggregated resuts by enumeration areas
Published date: 17/04/2025
Description:
Necessary corrections were made in the mesh of Enumeration Areas, causing the relocation of 18 housing units to a different enumeration area in the file “Agregados_por_setores_basico_BR.zip”. Variable V00003 had its name corrected from “Domicílios Coletivos Com Morador” to “Unidades de Habitação em Domicílios Coletivos Com Morador” in the file “Dicionário de dados”. Other 15 blank variables - V00236, V00243, V00250, V00257, V00280, V00281, V00282, V00283, V00284, V00303, V00304, V00556, V00563, V00570 and V00577 - were corrected in the files “Agregados_por_setores_caracteristicas_domicilios2.zip” and “Agregados_por_setores_caracteristicas_domicilios3.zip”.Actions: Replacement of files available for download on the release page an in the Methodological note no. 06/2024.
Replacement of publication Methodological notes no.07/2024: Sample expansion process for preliminary results
Published date: 30/01/2025
Description:
The amendment of the title of the methodological note referenced on page 11 of the publication was required.Actions: The publication has been replaced and the title of the methodological note, which talks about the construction of preliminary weighting areas, has been changed.
Correction of data in two graphs of the topic Indigenous peoples on the 2022 Census Overview website
Published date: 09/10/2024
Description:
The graphs "Population in indigenous lands" and "Indigenous lands by location of housing unit" of the 2022 Census Overview website presented incorrect data in the period between September 26 and October 04, 2024.Actions: The error was corrected on the 2022 Census Overview website in the afternoon of October 04.
Replacement of the publication 2022 Population Census: Indigenous Population: Literacy, birth records and characteristics of housing units, by specific areas: Population Results
Published date: 08/10/2024
Description:
Correction of two pieces of data in the last paragraph of page 42 of the complete publication. Instead of 24 municipalities, there are 25 where the proportion of the population living in housing units with a bathroom for exclusive use in 2022 was below 50% and, instead of 668 municipalities, there are 669 where this proportion was below 90%.
Five pieces of data on pages 164, 202, 218 and 219 of the publication were corrected. On page 164, the figure informed was 621 079 housing units, while the correct figure is 342 080 housing units. On page 202, the figure informed was 621 079 housing units, but the right figure is 516 176 housing units. On pages 218 and 219, percent changes were corrected from 9.42% to 9.39%; from 34.70% to 34.71%; and from 0.55% to 0.56%.Actions: The complete publication was replaced.
Replacement of 2022 Population Census: Characteristics of housing units: Population results publication
Published date: 05/06/2024
Description:
Amendment of two data in the last paragraph of page 42 of the complete publication. Instead of 24 municipalities, they are 25 in which the proportion of the population living in housing units with exclusive bathrooms in 2022 was lower than 50%, and, instead of 668 municipalities, they are 669 in which this proportion was lower than 90%.
Actions: The complete publication has been replaced.Error in release "Population and households - First results", specifically in results of municipalities Abel Figueiredo (PA) and São Pedro da Água Branca (MA)
Published date: 22/12/2023
Description:
Error in the data collection, pinpointed by the IBGE, in the inter-state border between Pará and Maranhão, in the municipalities of Abel Figueiredo (PA) and São Pedro da Água Branca (MA). The amendment caused the transference of a contingent of 894 persons and 330 households, being 265 occupied households with interviews from Abel Figueiredo (PA) to São Pedro da Água Branca (MA).Actions:
Tables SIDRA 4709, 4711, 4712 e 4714 of the "Population and Households -First Results" release with the amendments were made available on December 22, 2023.Observation:
The IBGE is producing a Technical Note, to be released soon, detailing this problem and showing all the actions aiming at its amendment.Error in release "Population by age and sex - Results of the universe", specifically in results of municipalities Abel Figueiredo (PA) and São Pedro da Água Branca (MA)
Published date: 22/12/2023
Description:
Error in the data collection, pinpointed by the IBGE, in the inter-state border between Pará and Maranhão, in the municipalities of Abel Figueiredo (PA) and São Pedro da Água Branca (MA). The amendment caused the transference of a contingent of 894 persons from Abel Figueiredo (PA) to São Pedro da Água Branca (MA).Actions:
Tables SIDRA 1209, 9514 e 9515 of the "Population by age and sex - Results of the Universe" release with the amendments were made available on December 22, 2023.Observation:
The IBGE is producing a Technical Note, to be released soon, detailing this problem and showing all the actions aiming at its amendment.Calendar error in the release of 2022 Population Census: Population by age and sex - Persons aged 60 years and over publication
Published date: 01/11/2023
Description:
Error, pinpointed by the IBGE, for not publishing the release date of the document titled "2022 Population Census: Population by age and sex - Persons aged 60 years and over" in the release calendar. The document was produced to complement the "2022 Population Census: Population by age and sex: Results of the universe" publication, released on October 27, 2023. Aware of the relevance of this theme, the text specifically deals with the population aged 60 years and over, which are the people considered Elderly persons according to the Statute of Elderly Persons.Actions: Release of a Highlight on the availability of the "2022 Population Census: Population by age and sex - Persons aged 60 years and over" document.
Calendar error in the release of the “2022 Population Census: Population by age and sex - Results of the universe” publication
Published date: 04/10/2023
Description:
Error, pinpointed by the IBGE, for not meeting the minimum 30-day anticipation to inform the public on the release date of the 2022 Population Census: Population by age and sex - Results of the universe publication, released on June 28, 2023. The release and updating will occur on October 27, 2023.Actions: The Highlight has been published on October 4, 2023.
Calendar error in release of “2022 Population Census: Indigenous: First results of universe” publication
Published date: 25/07/2023
Description:
An error, pinpointed by the IBGE, for not meeting a minimum of 30 days to inform the public the release date of the 2022 Population Census: Indigenous: First results for the universe publication. The release will be on August 7, 2023.Actions: The release notice updated on July 11, 2023 was once again updated on this date, informing the postponement of the date from August 2 to August 7, 2023.
Correction in the Oracle database and BME concerning specific variables on Indians
Published date: 05/02/2018
Description: Some registers of non-Indian persons or persons who did not live in Indian lands received incorrect values in specific variables of this subject.
Actions: The file was corrected and replaced in the Oracle database and BME.
Complementation of the nomenclature of the cells of the vector files of the Statistical Grid of the 2010 Census
Published date: 06/10/2016
Description: Complementation of the nomenclature of the cells of the grid, maintaining its statistical content and spatial characteristics unchanged.
Actions: The vector files have been replaced.
Complementation of nomenclature for cells of vector files of the Statistical Grid for the 2010 Census
Published date: 06/10/2016
Description: Complementation of the nomenclature of the grid cells, without change of the statistical content or of spatial characteristics.
Actions: Vector files replaced.
Correction of a secondary error in the Results of the Universe - Census
Published date: 28/07/2015
Description: Difference detected among totals of the same variables in different spreadsheets of the Aggregate by enumeration area of the universe - 2010 Census.
Actions: Correction in the database with indication in the news list of the page that accesses the database.
Amendment of a secondary error in Results of the Universe - 2010 Census
Published date: 25/05/2015
Description: Difference detected among total figures of the same variables in different spreadsheets of the Aggregate by enumeration area of the universe - 2010 Census.
Actions: Amendment in database, indicating the access page to the database in the news list.