

Nossos serviços estão apresentando instabilidade no momento. Algumas informações podem não estar disponíveis.
-
Home

-
Statistics
-
Social
-
Labor
- NP-Novo Portal
POF - Consumer Expenditure Survey
About - Anthropometry and nutritional status of children, teenagers and adults in Brazil
With the release of this publication, IBGE provides society with a new group of results of the Consumer Expenditure Survey - POF 2008-2009, conducted only six years after its previous edition, as a result of a partnership with the World Bank, within the Human Development Technical Assistance Loan (HD TAL), and an agreement with the Ministry of Health. Being of fundamental importance to reduce the gap between the two editions of such a relevant national survey, the resources and technical support made available promoted the obtaining of material and technical inputs employed in the current edition, and also accounted for the elaboration of studies and tests aimed at the improvement and future implementation of continuous surveys of this kind.
After the release of the Consumer Expenditure Survey 2008-2009: expenditure, income and life conditions publication, this volume now brings the results relative to the anthropometric measurements of children, teenagers and adults investigated in this survey. In order to analyze the results, the IBGE had the contribution of renowned and skilled technicians from the Ministry of Health and nutrition specialists hired by the same ministry. The reference used for measurement comparisons regarding sex and age was the growth curve established by the WHO Multicentre Growth Reference Study Group. Besides the profile of growth and evolution of the weight of children, teenagers and adults, the publication presents an analysis of the nutritional status of these groups according to anthropometric measures indicated to evaluate them. Comparisons with results from previous approaches are some of the highlights in the current study. The information released about Brazil encompasses urban and rural reality. For Major Regions and Federation Units, results have been totalized.
Main results - Anthropometry and nutritional status of children, teenagers and adults in Brazil
#tabelasidra201764133643209
#tabelasidra201764133734951
Tables - Anthropometry and nutritional status of children, teenagers and adults in Brazil
- -#coefficient of variation - Anthropometry and nutritional status of children, teenagers and adults in Brazil
- -Complete Tables (zip) #POF2009
Coefficients of Variation
- Brazil
(updated on June 4, 2013 - Revision of decimal places of some coefficients of variation in Tab_1.1a and Tab_1.1b) - Major Regions
- Federation Units
- Tables of prevalence (tables pertaining to the "Commentaries" section of the publication)
(updated on June 4, 2013 - Revision of decimal places of some coefficients of variation in table 15 of this set of sheets).
Complete Tables (zip)
Brazil
Table 1.1 - Sample data and population estimates of the medians of height and weight, by household situation and sex, considering age and age group - Brasil - period 2008-2009
Major Regions
Table 2.1 - Sample data and population estimates of the medians of height and weight, by household situation and sex, considering age and age group - North Region - period 2008-2009
Table 2.2 - Sample data and population estimates of the medians of height and weight, by household situation and sex, considering age and age group - Northeast Region - period 2008-2009
Table 2.3 - Sample data and population estimates of the medians of height and weight, by household situation and sex, considering age and age group - Southeast Region - period 2008-2009
Table 2.4 - Sample data and population estimates of the medians of height and weight, by household situation and sex, considering age and age group - South Region - period 2008-2009
Table 2.5 - Sample data and population estimates of the medians of height and weight, by household situation and sex, considering age and age group - Central-West Region - period 2008-2009
Federation Units
Table 3.1 - Sample data and population estimates of the medians of height and weight of the population, by sex, considering age and age group - Rondônia - period 2008-2009
Table 3.2 - Sample data and population estimates of the medians of height and weight of the population, by sex, considering age and age group - Acre - period 2008-2009
Table 3.3 - Sample data and population estimates of the medians of height and weight of the population, by sex, considering age and age group - Amazonas - period 2008-2009
Table 3.4 - Sample data and population estimates of the medians of height and weight of the population, by sex, considering age and age group - Roraima - period 2008-2009
Table 3.5 - Sample data and population estimates of the medians of height and weight of the population, by sex, considering age and age group - Pará - period 2008-2009
Table 3.6 - Sample data and population estimates of the medians of height and weight of the population, by sex, considering age and age group - Amapá - period 2008-2009
Table 3.7 - Sample data and population estimates of the medians of height and weight of the population, by sex, considering age and age group - Tocantins - period 2008-2009
Table 3.8 - Sample data and population estimates of the medians of height and weight of the population, by sex, considering age and age group - Maranhão - period 2008-2009
Table 3.9 - Sample data and population estimates of the medians of height and weight of the population, by sex, considering age and age group - Piauí - period 2008-2009
Table 3.10 - Sample data and population estimates of the medians of height and weight of the population, by sex, considering age and age group - Ceará - period 2008-2009
Table 3.11 - Sample data and population estimates of the medians of height and weight of the population, by sex, considering age and age group - Rio Grande do Norte - period 2008-2009
Table 3.12 - Sample data and population estimates of the medians of height and weight of the population, by sex, considering age and age group - Paraíba - period 2008-2009
Table 3.13 - Sample data and population estimates of the medians of height and weight of the population, by sex, considering age and age group - Pernambuco - period 2008-2009
Table 3.14 - Sample data and population estimates of the medians of height and weight of the population, by sex, considering age and age group - Alagoas - period 2008-2009
Table 3.15 - Sample data and population estimates of the medians of height and weight of the population, by sex, considering age and age group - Sergipe - period 2008-2009
Table 3.16 - Sample data and population estimates of the medians of height and weight of the population, by sex, considering age and age group - Bahia - period 2008-2009
Table 3.17 - Sample data and population estimates of the medians of height and weight of the population, by sex, considering age and age group - Minas Gerais - period 2008-2009
Table 3.18 - Sample data and population estimates of the medians of height and weight of the population, by sex, considering age and age group - Espírito Santo - period 2008-2009
Table 3.19 - Sample data and population estimates of the medians of height and weight of the population, by sex, considering age and age group - Rio de Janeiro - period 2008-2009
Table 3.20 - Sample data and population estimates of the medians of height and weight of the population, by sex, considering age and age group - São Paulo - period 2008-2009
Table 3.21 - Sample data and population estimates of the medians of height and weight of the population, by sex, considering age and age group - Paraná - period 2008-2009
Table 3.22 - Sample data and population estimates of the medians of height and weight of the population, by sex, considering age and age group - Santa Catarina - period 2008-2009
Table 3.23 - Sample data and population estimates of the medians of height and weight of the population, by sex, considering age and age group - Rio Grande do Sul - period 2008-2009
Table 3.24 - Sample data and population estimates of the medians of height and weight of the population, by sex, considering age and age group - Mato Grosso do Sul - period 2008-2009
Table 3.25 - Sample data and population estimates of the medians of height and weight of the population, by sex, considering age and age group - Mato Grosso - period 2008-2009
Table 3.26 - Sample data and population estimates of the medians of height and weight of the population, by sex, considering age and age group - Goiás - period 2008-2009
Table 3.27 - Sample data and population estimates of the medians of height and weight of the population, by sex, considering age and age group - Distrito Federal - period 2008-2009
Prevalence Tables
Table 6 - Prevalence of deficit of height in children aged 5 or less, based on the reference disrtribution relative to children of families with total income and monthly asset change of more than 1 minimum wage per capita, by sex, considering age - Brazil - period 2008-2009
Table 7 - Prevalence of deficit of height in children aged 5 or less, based on the reference disrtribution relative to children of families with total income and monthly asset change of more than 1 minimum wage per capita, by household situation, considering Major Regions - period 2008-2009
Table 8 - Prevalence of deficit of height in children aged 5 or less, based on the reference disrtribution relative to children of families with total income and monthly asset change of more than 1 minimum wage per capita, by total inome class and family monthly asset change per capita - Brazil - period 2008-2009
Table 9 - Anthropometric indicators in the 5-to-9 population, based on the reference distribution of the World Health Organization - OMS, by sex, considering age - Brazil - period 2008-2009
Table 10 - Anthropometric indicators in the 5-to-9 population, based on the reference distribution of the World Health Organization - OMS, by sex and household situation, considering Major Regions - period 2008-2009
Table 11 - Anthropometric indicators in the 5-to-9 population, based on the reference distribution of the World Health Organization - OMS, by sex, considering total income class and family monthly asset change per capita - Brazil - period 2008-2009
Table 12 - Anthropometric indicators in the 10-to-19 population, based on the reference distribution of the World Health Organization - OMS, by sex, considering age groups - Brazil - period 2008-2009
Table 13 - Anthropometric indicators in the 10-to-19 population, based on the reference distribution of the World Health Organization - OMS, by sex and household situation, considering Major Regions - period 2008-2009
Table 14 - Anthropometric indicators in the 10-to-19 population, based on the reference distribution of the World Health Organization - OMS, by sex, considering total income class and family monthly asset change per capita - Brazil - period 2008-2009
Table 15 - Prevalence of deficit of weight, of excessive weight and obesity, in the 20-or-over population, according to the criteria of the World Health Organization - OMS, by sex, considering age groups - Brazil - period 2008-2009
Table 16 - Prevalence of deficit of weight, of excessive weight and obesity in the 20-or-over population, according to the criteria of the World Health Organization - OMS, by sex and household situation, considering Major Regions - period 2008-2009
Table 17 - Prevalence of deficit of weight, of excessive weight and obesity in the 20-or-over population, according to the criteria of the World Health Organization - OMS, by sex, considering total income class and family monthly asset change per capita - Brazil - period 2008-2009
Concepts and methods - Anthropometry and nutritional status of children, teenagers and adults in Brazil
As informações a seguir descrevem os metadados estatísticos, que são o conjunto de conceitos, métodos e aspectos relacionados às estatísticas, e são informações necessárias para compreender as características e a qualidade das estatísticas e interpretá-las corretamente.
Informações Gerais
Objetivo
As informações da pesquisa são utilizadas para atualizar as estruturas de ponderações, necessárias para a produção dos Índices de Preços ao Consumidor (Índices, calculados e publicados mensalmente pelo IBGE, que indicam a variação média ocorrida nos preços do conjunto de bens consumidos e de serviços utilizados pela população) e também na atualização da participação das despesas das famílias no cálculo das Contas Nacionais. Além disso, permitem estudar a evolução dos hábitos de consumo das famílias e possibilitam os mais variados estudos e planejamentos sobre: distribuição, concentração e desigualdade de renda, aspectos demográficos e socioeconômicos, quantidade adquirida "per capita". A partir da POF 2002-2003, além de cobrir todo o País (áreas urbana e rural), foram incluídas as aquisições de produtos realizadas pelas famílias através de aquisições não monetárias (doações, trocas, retiradas do negócio, produção própria). Também foram incluídos novos temas relacionados à nutrição, investigando as medidas antropométricas - peso e altura -, a quantidade de alimentos adquiridos no domicílio e pesquisando também aspectos sobre as condições de vida das famílias - Questionário de avaliação subjetiva das condições de vida. Na POF 2008-2009, todos os objetivos e temas descritos anteriormente foram mantidos como também a abrangência geográfica. Também, nesta pesquisa atendendo novas demandas, foram incluídas variáveis relacionadas aos temas Meio Ambiente, Turismo, Assistência à Saúde, Fecundidade e também maiores detalhamentos em relação a antropometria. Nesta versão da pesquisa, foi incluída uma primeira experiência na utilização de um modelo metodológico para investigação do consumo efetivo pessoal, definido e trabalhado em parceria com o Ministério da Saúde. Este modulo foi pesquisado através do Bloco de consumo alimentar pessoal - POF7.Tipo de operação estatística
Pesquisa de orçamento familiarTipo de dados
Dados de pesquisa por amostragem probabilísticaPeriodicidade de divulgação
QuinquenalPopulação-alvo
Domicílios particulares permanentes ocupados e seus moradores, na área de abrangência da pesquisa nas situações urbana e rural. Foram excuídas as áreas definidas pelo IBGE como sendo quartéis, bases militares, alojamentos, acampamentos, embarcações, penitenciárias, colônias penais, presídios, cadeias, asilos, orfanatos, conventos e hospitais.Metodologia
A seleção da amostra adotada nas pesquisas utilizou um plano amostral conglomerado em dois estágios de seleção, com estratificação geográfica e estatística das unidades de primeiro estágio. Os setores correspondem às unidades do primeiro estágio de seleção e os domicílios particulares permanentes, às unidades do segundo estágio.
Para garantir a distribuição de todos os estratos geográficos e socioeconômicos durante os doze meses, a POF foi dividida em 52 períodos de sete dias. Para cada domicílio selecionado, foram indicados aleatoriamente, dentre esses períodos, dois consecutivos em que obrigatoriamente foi iniciada a coleta.
As informações da POF foram obtidas diretamente nos domicílios particulares permanentes selecionados, por meio de entrevistas realizadas pelas Equipes Regionais do IBGE, junto aos seus moradores, durante um período de nove dias consecutivos, através da aplicação de equipamentos eletrônicos sob a forma de entrevistas e de registros diários pelo informante.
Os procedimentos metodológicos adotados para o tratamento das informações coletadas na POF são: validação na entrada de dados, tratamento do efeito inflacionário sobre as informações de valores (deflacionamento ou inflacionamento), análise do valor das despesas e rendimentos, alocação das despesas informadas na forma agregada, tratamento da não resposta de valores de despesas e rendimentos, anualização dos valores de despesas e rendimentos e o tratamento das informações de quantidades adquiridas de alimentos.
O Bloco de consumo alimentar pessoal (POF7) foi investigado em uma subamostra de domicílios selecionados, durante dois dias não consecutivos, para os moradores com 10 anos ou mais de idade, para o registro de todos os alimentos e bebidas consumidos dentro e fora do domicílio.
Técnica de coleta:
PAPI - Entrevista pessoal com questionário em papel, CAPI - Entrevista pessoal assistida por computadorTemas
Temas e subtemas
Família, Grupos populacionais específicos, Rendimento, despesa e consumo, Estatísticas multidomínio, População, Condições de vida, pobreza e desigualdade, Habitação, Saúde, Proteção socialPrincipais variáveis
Domicilio: tipo do domicílio; cômodos - total, servindo de dormitórios e total de banheiros; condição de ocupação; abastecimento de água; esgotamento sanitário; origem da energia elétrica; material que predomina no piso; pavimentação na rua do domicílio; tempo de moradia; e características do aluguel.Famílias: tamanho da família; e bens duráveis (inventário), condições de vida.
Pessoas: relação com a pessoa de referência da família; condição de presença; idade; sexo; nível de escolaridade; cor ou raça; religião; peso e altura; atividade/ocupação.
Orçamentos: despesa global; despesa corrente; despesa de consumo; aumento do ativo; diminuição do passivo; local de compra; despesa mensal familiar; rendimento total; rendimento do trabalho; transferências; rendimento de aluguel; outros recebimentos; rendimento mensal domiciliar; rendimento mensal familiar; rendimento mensal pessoal e movimentação financeira.
Na POF 2008-2009, foram incluídas as seguintes variáveis relacionadas ao tema meio ambiente: localização do domicílio, separação do lixo, coleta seletiva do lixo, destino do lixo, origem da energia elétrica, fonte própria de energia elétrica, aquecimento de água, combustível utilizado no fogão.
Também foram incluídas variáveis relacionadas ao tema nutrição como: amamentação materna, alimentação escolar. E ainda foram incluídas variáveis do tema fecundidade.
Unidades de informação
Unidade de investigação
Família, Pessoa, Domicílio, ProdutoUnidade de análise
Família, Pessoa, Domicílio, Produto.Períodos de referência
Data de início da coleta
19/05/2008Data do fim da coleta
18/05/2009Disseminação
Formas de disseminação
Publicação Digital (online), Publicação impressa com CD-ROM, CD-ROM com microdados, Banco Multidimensional de Estatísticas - BMENível de divulgação
Para áreas urbanas, os resultados foram produzidos nos níveis Nacional, Grandes Regiões, Unidades da Federação, nove Regiões Metropolitanas (Belém, Fortaleza, Recife, Salvador, Belo Horizonte, Rio de Janeiro, São Paulo, Curitiba e Porto Alegre) e todas as capitais das Unidades da Federação. Para áreas rurais, os resultados foram produzidos nos níveis Nacional e Grandes Regiões.Instrumentos de coleta
POF 1 - Características do domicílio e dos moradores
POF 2 - Questionário de aquisição coletiva
POF 3 - Caderneta de aquisição coletiva
POF 3 - Folha suplementar
POF 4 - Questionário de aquisição individual
POF 5 - Questionário de trabalho e rendimento individual
POF 6 - Avaliação das condições de vida
POF 7 - Bloco de consumo alimentar pessoal .
Histórico
A segunda pesquisa realizada no período de 1995-1996, teve a mesma abrangência da anterior e visou a atender aos mesmos objetivos.
A terceira Pesquisa de Orçamentos Familiares 2002-2003 deu igual prioridade às utilizações descritas anteriormente, além de atender a novas demandas, principalmente aquelas relacionadas a aspectos de nutrição e condições de vida. A partir desta edição a abrangência geográfica foi ampliada para todo território Nacional, cobrindo todas as áreas urbana e rural do país.
Em 2008-2009 o IBGE realizou a quarta pesquisa, que além de manter o objetivo principal - Orçamentos Familiares -, que permite obter as estruturas de consumo das famílias e também o valor total da conta família, também incluiu os temas nutrição e condições de vida, tendo um maior aprofundamento no tema nutrição. O modelo metodológico da pesquisa também atendeu diversas novas demandas, sendo incluídas diversas variáveis relacionadas a Meio Ambiente, Turismo, Assistência à Saúde e Fecundidade.
Nesta pesquisa, também foi incluída uma primeira experiência metodológica de investigação do consumo efetivo pessoal. Através de um novo questionário - Bloco de consumo pessoal individual (POF7), o consumo efetivo de alimentos e bebidas no domicílio e fora do domicílio foi investigado para uma subamostra de domicílios, .
Saiba mais
https://metadados.ibge.gov.br/consulta/estatisticos/operacoes-estatisticas/OFPublications - Anthropometry and nutritional status of children, teenagers and adults in Brazil
Description
The Consumer Expenditure Survey - POF assesses the structures of consumption, expenditures, income and part of the asset variation of the households, providing a profile of the life conditions of the population based on the analysis of the household budgets. In addition to the information directly associated with the budget structure, a number of characteristics of the housing units and households are also investigated, including the subjective self-assessment of life quality. The results of the survey also allow to study the composition of the household expenditures according to the income classes, regional disparities, urban and rural status, diffusion and volume of transfers between different income classes, as well as the dimension of the consumer market for groups of products and services. The survey has the household as the investigation unit and it is based on sampling.
The 2008-2009 POF was the fifth survey carried out by the IBGE on household budget. The previous editions were: the 1974-1975 National Study of Household Expenditure - ENDEF, with a nationwide coverage, except for the rural areas of the North and Central-West Regions; the 1987-1988 POF; the 1995-1996 POF; and the 2002-2003 POF. The Consumer Expenditure Surveys of the 1980s and 1990s were conceived to primarily update the consumer structures of the consumer price indexes produced by the IBGE, being accomplished in the Metropolitan Areas of Belém, Fortaleza, Recife, Salvador, Belo Horizonte, Rio de Janeiro, São Paulo, Curitiba and Porto Alegre, in the Municipality of Goiânia, and in the Federal District. Besides covering the entire Brazilian territory, the POFs of the 2000s included additional subjects over the previous editions, due to the need of detailed information on the life conditions based on the consumption, particularly of the households with lower income, the reason why the rural area was included in the geographic coverage and the non-monetary purchases were also investigated.
The current sample design of POF was structured in such a way that it releases the results at the following levels: Brazil, Major Regions and also by urban or rural status. The results include the totals and the urban situation for the Federation Units. The results correspond to the urban situation in the nine Metropolitan Areas and Municipalities of the Capitals. As of the project called Master Sample, developed by the IBGE to implement the Integrated System of Household Surveys - SIPD, the Consumer Expenditure Surveys had the sample design defined by the Master Sample, and its sectors selected among those from that sample.
Microdata
2017-2018
Updated on 3/4/2021
- Data
- Documentation - updated on 04/23/2021
- Questionnaires - updated on 04/23/2021
- Table Translators
- Reading Software
- Calculation Memory
- Readme
2008-2009
- Data - updated on 10/05/2021
- Documentation - updated on 10/05/2021
- Questionnaries
- Table Translators
- Manual of the Survey Agent
- Readme
2002-2003
Downloads
Technical Information
Methodological considerations on the Consumer Expenditure Survey can be obtained in the Technical notes chapter of its results publication.
News and Releases
POF 2017-2018
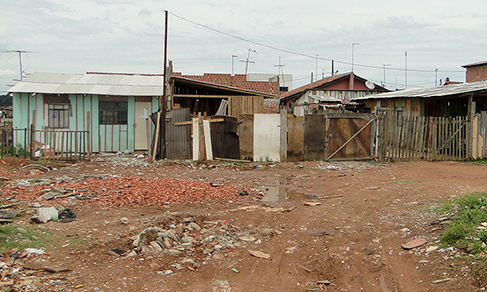
Three new indexes show drop of poverty and vulnerability between 2008-2009 and 2017-2018
For the first time ever, the IBGE releases, as experimental statistics, the Evolution of Non-Monetary...
25/08/2023
POF 2017-2018
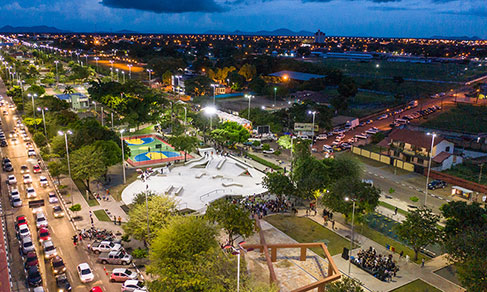
POF: Socioeconomic performance index for Brazil grows 12.8% between 2008 and 2018
The IBGE released today (23) an updating of the indicators that measure the quality of life of the Brazilian...
23/06/2023
POF 2017-2018
2017-2018 POF: Loss of quality of life is almost twice as much in rural areas
The IBGE presents for the first time a multidimensional index for the loss of quality of life (IPQV),...
26/11/2021

POF 2017-2018
Loss of quality of life is almost twice as much in rural areas
The loss of quality of life of people living in the rural areas of the country is almost twice as big...
26/11/2021
POF 2017-2018
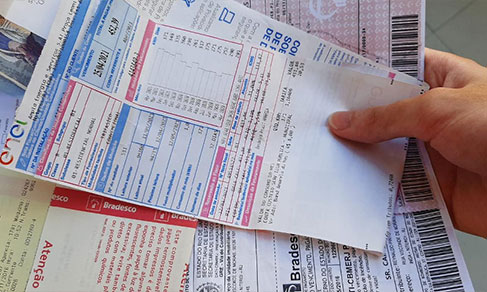
POF 2017-2018: 72.4% of Brazilians lived in households that had trouble paying for monthly expenses
Approximately 72.4% of Brazilians lived in housing units having trouble paying for monthly expenses,...
19/08/2021
POF 2017-2018
Households headed by white persons spend almost twice on travel and leisure than those headed by blacks or browns
Households headed by white persons spent almost twice on travel and leisure, between 2017 and 2018, than...
19/08/2021

POF 2017-2018
72.4% of Brazilians live in households that have trouble paying their bills
Approximately 72.4% of the Brazilian population lived were members of households that had trouble paying...
19/08/2021
POF 2017-2018
30% of the population with the lowest earnings live on less than the necessary amount to make ends meet
About 30% of the persons with the lowest earnings in the country, between 2017 and 2018, lived on less...
25/11/2020
POF 2017-2018
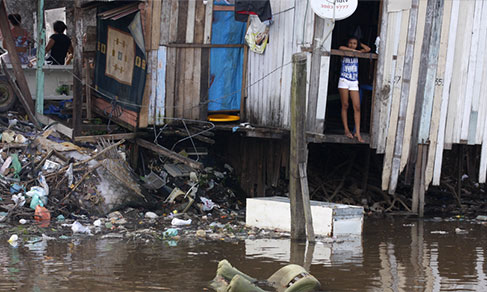
2017-2018 POF: proportion of food secure households stands below 2004 level
In 2017-2018, of the 68.9 million households in Brazil, 36.7% (equivalent to 25.3 million) had some degree...
17/09/2020
POF 2017-2018
10.3 million persons live in households with severe food insecurity
Severe food insecurity was present in the home of 10.3 million Brazilians at least for some time between...
17/09/2020
Errata
Amendment of the average intake of fibers for women aged 60 years and over, in table 15 of POF 2017-2018 – Analysis of personal food intake in Brazil
Published date: 15/01/2021
Description:
Identification of an error in the generation of Table 15, only for the cell on the average intake of fibers for women aged 60 years and over.Actions: The result was reviewed and updated in the publication table.
Calendar error in the release of the Consumer Expenditure Survey - POF 2017-2018 - Household Food Acquisition per Capita
Published date: 12/07/2019
Description:
An error, identified by the IBGE, for the non-compliance with the release data established in December 2018. Due to rescheduling, the new release date for the results of the Consumer Expenditure Survey - POF 2017-2018 - Household Food Acquisition per Capita for the 1st semester of 2020.
Actions: The release calendar was corrected.
Descrição:
Erro, identificado pelo IBGE, pelo não cumprimento da data de divulgação da pesquisa, conforme calendário disponibilizado em dezembro de 2018. Em virtude da necessidade de readequação de prazos, a data de divulgação dos resultados da Pesquisa de Orçamentos Familiares POF 2017-2018 -Aquisição Alimentar Domiciliar per Capita foi reagendada para o primeiro semestre de 2020.
Ações: O calendário de divulgação foi alterado.Calendar error in the release of the Consumer Expenditure Survey (POF) 2017-2018 - First Results
Published date: 10/06/2019
Description:
An error, detected by the IBGE, relative to non-compliance to the release date informed in the calendar made available in December 2018. Due to the need of rescheduling, the new release date of the Consumer Expenditure Survey (POF) 2017-2018 - First results is October 04, 2019.
Actions: The release calendar was changed.
Calendar Error in the Consumer Expenditure Survey 2017-2018 - Household Food Acquisition per Capita
Published date: 10/06/2019
Description:
An error, detected by the IBGE, relative to non-compliance to the release date informed in the calendar made available in December 2018. Due to the need of rescheduling, the new release date of results of the Consumer Expenditure Survey 2017-2018 - Household Food Acquisition per Capita is December 18, 2019.Actions: The release calendar was changed.
Nutritional composition of food
Tables of Nutritional Composition of Food Intake in Brazil
To see comparative graphs and information tables, select at least one item in the "Food" menu and one in the "Preparation Method(s)" menu and click on "Insert food".