

Nossos serviços estão apresentando instabilidade no momento. Algumas informações podem não estar disponíveis.
-
Home

-
Statistics
-
Social
-
Population
- NP-Population Census
Population Census
About - Profile of Elderly Heads of Household in Brazil
This publication presents indicators which portray the profile of persons at 60 years of age or over, especially those who were household heads, based on information taken from the questionnaire of the 2000 Population Census for the Brazilian population universe.
It includes the geographic distribution of this group by Major Region, Federation Units and capitals, highlighting their position in the household, their level of schooling and monthly income, as well as information about family arrangements and the conditions of urban sanitation in households which are under the responsibility of elderly persons. It also brings commentaries about the social indicators selected, comparative data of the the Population Censuses of 1991 and 2000, and the differences observed in the comparison of Regions.
These results are available on the CD-ROM included with the publication; it also brings information about the profile of elderly household heads in the 5 507 municipalities created on August 1 st , 2000, the survey reference date.
This profile is a valuable tool for the evaluation of social, economic and regional characteristics of Brazilian elderly people.
Tables - Profile of Elderly Heads of Household in Brazil
- -Table 1 #Censo2000
- -Table 7 #Censo2000
- -Table 11 #Censo2000
- -Table 13 #Censo2000
- -Result tables (in excel) #Censo2000
- -Table 22 #Censo2000
- -Municipal tables (excel) #Censo2000
Table 1
Resident population, total and 60 years old and above, by sex and age groups, according to Major Regions and Federation Units - 1991/2000
| 1991 | |||||||
|---|---|---|---|---|---|---|---|
| Major Regions and Federation Units | Total Resident Population | Resident population aged 60 and above, by sex | |||||
| Total | Age groups (%) | ||||||
| Absolute | Relative | 60 to 64 | 65 to 69 | 70 to 74 | 75 and above | ||
| Brazil | 146 825 475 | 10 722 705 | 7.3 | 2.5 | 1.9 | 1.3 | 1.6 |
| North | 10 030 556 | 463 957 | 4.6 | 1.6 | 1.2 | 0.8 | 1.0 |
| Rondônia | 1 132 692 | 42 845 | 3.8 | 1.6 | 1.1 | 0.6 | 0.6 |
| Acre | 417 718 | 19 948 | 4.8 | 1.6 | 1.3 | 0.9 | 1.0 |
| Amazonas | 2 103 243 | 88 805 | 4.2 | 1.5 | 1.1 | 0.7 | 0.9 |
| Roraima | 217 583 | 7 233 | 3.3 | 1.2 | 0.9 | 0.5 | 0.6 |
| Pará | 4 950 060 | 241 906 | 4.9 | 1.7 | 1.2 | 0.8 | 1.1 |
| Amapá | 289 397 | 11 349 | 3.9 | 1.3 | 0.9 | 0.6 | 1.0 |
| Tocantins | 919 863 | 51 871 | 5.6 | 1.9 | 1.5 | 1.0 | 1.3 |
| Northeast | 42 497 540 | 3 087 586 | 7.3 | 2.2 | 1.9 | 1.3 | 1.8 |
| Maranhão | 4 930 253 | 298 553 | 6.1 | 1.9 | 1.6 | 1.2 | 1.4 |
| Piauí | 2 582 137 | 171 247 | 6.6 | 2.1 | 1.7 | 1.2 | 1.7 |
| Ceará | 6 366 647 | 490 505 | 7.7 | 2.3 | 2.0 | 1.3 | 2.0 |
| Rio Grande do Norte | 2 415 567 | 199 122 | 8.2 | 2.3 | 2.1 | 1.5 | 2.2 |
| Paraíba | 3 201 114 | 289 756 | 9.1 | 2.5 | 2.3 | 1.8 | 2.4 |
| Pernambuco | 7 127 855 | 559 068 | 7.8 | 2.4 | 2.0 | 1.5 | 1.9 |
| Alagoas | 2 514 100 | 161 263 | 6.4 | 2.0 | 1.6 | 1.2 | 1.6 |
| Sergipe | 1 491 876 | 101 182 | 6.8 | 2.0 | 1.7 | 1.2 | 1.9 |
| Bahia | 11 867 991 | 816 890 | 6.9 | 2.1 | 1.7 | 1.3 | 1.8 |
| Southeast | 62 740 401 | 4 984 058 | 7.9 | 2.8 | 2.1 | 1.4 | 1.7 |
| Minas Gerais | 15 743 152 | 1 188 992 | 7.6 | 2.6 | 2.0 | 1.3 | 1.7 |
| Espírito Santo | 2 600 618 | 175 001 | 6.7 | 2.4 | 1.7 | 1.1 | 1.5 |
| Rio de Janeiro | 12 807 706 | 1 182 594 | 9.2 | 3.3 | 2.4 | 1.6 | 2.0 |
| São Paulo | 31 588 925 | 2 437 471 | 7.7 | 2.8 | 2.0 | 1.3 | 1.6 |
| South | 22 129 377 | 1 699 531 | 7.7 | 2.7 | 2.0 | 1.4 | 1.6 |
| Paraná | 8 448 713 | 577 423 | 6.8 | 2.5 | 1.8 | 1.2 | 1.4 |
| Santa Catarina | 4 541 994 | 306 806 | 6.8 | 2.4 | 1.8 | 1.2 | 1.4 |
| Rio Grande do Sul | 9 138 670 | 815 302 | 8.9 | 3.1 | 2.3 | 1.6 | 2.0 |
| Central-West | 9 427 601 | 487 573 | 5.2 | 1.9 | 1.4 | 0.9 | 1.0 |
| Mato Grosso do Sul | 1 780 373 | 104 852 | 5.9 | 2.1 | 1.5 | 1.0 | 1.3 |
| Mato Grosso | 2 027 231 | 88 080 | 4.3 | 1.7 | 1.1 | 0.7 | 0.8 |
| Goiás | 4 018 903 | 230 435 | 5.7 | 2.1 | 1.5 | 1.0 | 1.2 |
| Distrito Federal | 1 601 094 | 64 206 | 4.0 | 1.6 | 1.1 | 0.6 | 0.7 |
| 2000 | |||||||
| Brazil | 169 799 170 | 14 536 029 | 8.6 | 2.7 | 2.1 | 1.6 | 2.1 |
| North | 10 030 556 | 707 071 | 5.5 | 1.8 | 1.4 | 1.0 | 1.3 |
| Rondônia | 1 379 787 | 72 062 | 5.2 | 1.9 | 1.4 | 0.9 | 1.0 |
| Acre | 557 526 | 30 404 | 5.5 | 1.7 | 1.3 | 1.0 | 1.4 |
| Amazonas | 2 812 557 | 137 060 | 4.9 | 1.6 | 1.2 | 0.9 | 1.2 |
| Roraima | 324 397 | 13 128 | 4.0 | 1.4 | 1.0 | 0.7 | 0.9 |
| Pará | 6 192 307 | 356 562 | 5.8 | 1.9 | 1.4 | 1.0 | 1.4 |
| Amapá | 477 032 | 19 443 | 4.1 | 1.4 | 1.0 | 0.7 | 1.0 |
| Tocantins | 1 157 098 | 78 412 | 2.2 | 1.7 | 1.2 | 1.6 | |
| Northeast | 47 741 711 | 4 020 857 | 8.4 | 2.6 | 1.9 | 1.6 | 2.4 |
| Maranhão | 5 651 475 | 405 914 | 7.2 | 2.3 | 1.8 | 1.2 | 1.9 |
| Piauí | 2 843 278 | 236 954 | 8.3 | 2.6 | 2.0 | 1.6 | 2.2 |
| Ceará | 7 430 661 | 658 989 | 8.9 | 2.7 | 2.0 | 2.5 | |
| Rio Grande do Norte | 2 776 782 | 250 594 | 9.0 | 2.6 | 1.9 | 1.7 | 2.8 |
| Paraíba | 3 443 825 | 350 566 | 10.2 | 3.0 | 2.2 | 1.9 | 3.1 |
| Pernambuco | 7 918 344 | 704 886 | 8.9 | 2.8 | 2.1 | 1.7 | 2.4 |
| Alagoas | 2 822 621 | 203 882 | 7.2 | 2.3 | 1.7 | 1.3 | 1.9 |
| Sergipe | 1 784 475 | 131 171 | 7.4 | 2.2 | 1.7 | 1.3 | 2.1 |
| Bahia | 13 070 250 | 1 077 901 | 8.2 | 2.5 | 1.9 | 1.5 | 2.3 |
| Southeast | 72 412 411 | 6 732 888 | 9.3 | 2.9 | 2.3 | 1.8 | 2.2 |
| Minas Gerais | 17 891 494 | 1 624 981 | 9.1 | 2.9 | 2.3 | 1.7 | 2.2 |
| Espírito Santo | 3 097 232 | 250 196 | 8.1 | 2.6 | 2.1 | 1.5 | 1.9 |
| Rio de Janeiro | 14 391 282 | 1 540 754 | 10.7 | 3.3 | 2.7 | 2.1 | 2.6 |
| São Paulo | 37 032 403 | 3 316 957 | 9.0 | 2.8 | 2.2 | 1.7 | 2.1 |
| South | 25 107 616 | 2 305 348 | 9.2 | 3.0 | 2.3 | 1.7 | 2.1 |
| Paraná | 9 563 458 | 809 431 | 8.5 | 2.8 | 2.2 | 1.6 | 1.9 |
| Santa Catarina | 5 356 360 | 430 433 | 8.0 | 2.7 | 2.0 | 1.5 | 1.8 |
| Rio Grande do Sul | 10 187 798 | 1 065 484 | 10.5 | 3.3 | 2.6 | 2.0 | 2.5 |
| Central-West | 11 636 728 | 769 865 | 6.6 | 2.3 | 1.7 | 1.2 | 1.4 |
| Mato Grosso do Sul | 2 078 001 | 157 093 | 7.6 | 2.5 | 1.9 | 1.4 | 1.8 |
| Mato Grosso | 2 504 353 | 144 318 | 5.8 | 2.1 | 1.5 | 1.0 | 1.2 |
| Goiás | 5 003 228 | 358 816 | 7.2 | 2.5 | 1.8 | 1.3 | 1.6 |
| Federal District | 2 051 146 | 109 638 | 5.3 | 2.1 | 1.3 | 0.9 | 1.1 |
| 1991 | |||||
|---|---|---|---|---|---|
| Major Regions and Federation Units |
Resident population aged 60 and above, by sex | ||||
| Men | Age groups (%) | ||||
| 60 to 64 | 65 to 69 | 70 to 74 | 75 and above | ||
| Brazil | 4 931 425 | 1 715 601 | 1 308 343 | 872 424 | 1 035 057 |
| North | 235 829 | 85 006 | 63 401 | 40 569 | 46 853 |
| Rondônia | 24 760 | 10 169 | 7 158 | 4 039 | 3 394 |
| Acre | 10 819 | 3 683 | 3 008 | 1 999 | 2 129 |
| Amazonas | 44 401 | 16 058 | 12 201 | 7 680 | 8 462 |
| Roraima | 3 993 | 1 513 | 1 115 | 658 | 707 |
| Pará | 118 720 | 42 437 | 31 188 | 20 226 | 24 869 |
| Amapá | 5 556 | 1 932 | 1 387 | 896 | 1 341 |
| Tocantins | 27 580 | 9 214 | 7 344 | 5 071 | 5 951 |
| Northeast | 1 448 482 | 435 607 | 381 594 | 272 454 | 358 827 |
| Maranhão | 147 141 | 45 627 | 40 515 | 28 231 | 32 768 |
| Piauí | 82 374 | 25 943 | 21 838 | 14 809 | 19 784 |
| Ceará | 230 281 | 69 147 | 62 129 | 40 834 | 58 171 |
| Rio Grande do Norte | 94 899 | 25 933 | 24 722 | 18 428 | 25 816 |
| Paraíba | 135 185 | 36 435 | 35 238 | 27 110 | 36 402 |
| Pernambuco | 254 971 | 79 002 | 67 977 | 49 018 | 58 974 |
| Alagoas | 75 822 | 22 947 | 19 368 | 14 394 | 19 113 |
| Sergipe | 46 094 | 13 149 | 11 632 | 8 599 | 12 714 |
| Bahia | 381 715 | 117 424 | 98 175 | 71 031 | 95 085 |
| Southeast | 2 223 760 | 816 999 | 592 256 | 380 976 | 433 529 |
| Minas Gerais | 544 191 | 191 486 | 144 460 | 95 153 | 113 092 |
| Espírito Santo | 83 131 | 30 187 | 21 625 | 13 763 | 17 556 |
| Rio de Janeiro | 500 805 | 188 443 | 133 897 | 84 669 | 93 796 |
| São Paulo | 1 095 633 | 406 883 | 292 274 | 187 391 | 209 085 |
| South | 776 188 | 285 529 | 205 229 | 136 876 | 148 554 |
| Paraná | 280 460 | 103 600 | 74 698 | 48 352 | 53 810 |
| Santa Catarina | 142 266 | 51 953 | 38 199 | 25 489 | 26 625 |
| Rio Grande do Sul | 353 462 | 129 976 | 92 332 | 63 035 | 68 119 |
| Central-West | 247 166 | 92 460 | 65 863 | 41 549 | 47 294 |
| Mato Grosso do Sul | 54 389 | 19 416 | 14 329 | 9 429 | 11 215 |
| Mato Grosso | 48 776 | 18 880 | 12 788 | 8 200 | 8 908 |
| Goiás | 115 420 | 42 121 | 30 998 | 19 663 | 22 638 |
| Federal District | 28 581 | 12 043 | 7 748 | 4 257 | 4 533 |
| 2000 | |||||
| Brazil | 6 533 784 | 2 153 209 | 1 639 325 | 1 229 329 | 1 511 921 |
| North | 355 580 | 121 959 | 91 209 | 64 142 | 78 270 |
| Rondônia | 40 017 | 14 573 | 10 625 | 7 344 | 7 475 |
| Acre | 16 096 | 5 034 | 3 891 | 3 076 | 4 095 |
| Amazonas | 66 912 | 22 565 | 17 144 | 12 121 | 15 082 |
| Roraima | 7 021 | 2 597 | 1 764 | 1 214 | 1 446 |
| Pará | 174 682 | 60 172 | 44 898 | 31 363 | 38 249 |
| Amapá | 9 473 | 3 342 | 2 440 | 1 562 | 2 129 |
| Tocantins | 41 379 | 13 676 | 10 447 | 7 462 | 9 794 |
| Northeast | 1 827 210 | 563 195 | 419 821 | 340 256 | 503 938 |
| Maranhão | 197 171 | 63 131 | 50 093 | 34 625 | 49 322 |
| Piauí | 111 131 | 35 001 | 26 483 | 20 914 | 28 733 |
| Ceará | 299 365 | 91 219 | 66 165 | 57 794 | 84 187 |
| Rio Grande do Norte | 114 119 | 32 720 | 23 574 | 21 930 | 35 895 |
| Paraíba | 155 840 | 45 010 | 32 462 | 29 230 | 49 138 |
| Pernambuco | 307 935 | 96 437 | 70 544 | 58 193 | 82 761 |
| Alagoas | 92 101 | 29 004 | 21 933 | 16 494 | 24 670 |
| Sergipe | 58 005 | 17 755 | 13 439 | 10 258 | 16 553 |
| Bahia | 491 543 | 152 918 | 115 128 | 90 818 | 132 679 |
| Southeast | 2 940 991 | 978 266 | 761 287 | 563 690 | 637 748 |
| Minas Gerais | 733 888 | 242 750 | 189 937 | 136 101 | 165 100 |
| Espírito Santo | 114 739 | 37 153 | 29 979 | 22 223 | 25 384 |
| Rio de Janeiro | 638 860 | 210 146 | 166 850 | 124 230 | 137 634 |
| São Paulo | 1 453 504 | 488 217 | 374 521 | 281 136 | 309 630 |
| South | 1 029 514 | 352 685 | 269 214 | 193 617 | 213 998 |
| Paraná | 381 105 | 130 948 | 99 638 | 71 611 | 78 908 |
| Santa Catarina | 194 348 | 67 836 | 50 300 | 36 101 | 40 111 |
| Rio Grande do Sul | 454 061 | 153 901 | 119 276 | 85 905 | 94 979 |
| Central-West | 380 489 | 137 104 | 97 794 | 67 624 | 77 967 |
| Mato Grosso do Sul | 78 768 | 26 858 | 20 059 | 14 325 | 17 526 |
| Mato Grosso | 77 186 | 28 335 | 20 294 | 13 565 | 14 992 |
| Goiás | 175 819 | 61 916 | 45 253 | 31 511 | 37 139 |
| Federal District | 48 716 | 19 995 | 12 188 | 8 223 | 8 310 |
| 1991 | |||||
|---|---|---|---|---|---|
| Major Region and Federation Units | Resident population aged 60 and above, by sex | ||||
| Women | Age groups (%) | ||||
| 60 to 64 | 65 to 69 | 70 to 74 | 75 and above | ||
| Brazil | 5 791 280 | 1 921 257 | 1 467 717 | 1 017 494 | 1 384 812 |
| North | 228 128 | 77 294 | 57 857 | 38 422 | 54 555 |
| Rondônia | 18 085 | 7 423 | 4 940 | 2 690 | 3 032 |
| Acre | 9 129 | 3 102 | 2 342 | 1 591 | 2 094 |
| Amazonas | 44 404 | 15 370 | 11 814 | 7 395 | 9 825 |
| Roraima | 3 240 | 1 170 | 922 | 503 | 645 |
| Pará | 123 186 | 40 453 | 30 381 | 20 977 | 31 375 |
| Amapá | 5 793 | 1 909 | 1 335 | 924 | 1 625 |
| Tocantins | 24 291 | 7 867 | 6 123 | 4 342 | 5 959 |
| Northeast | 1 639 104 | 501 380 | 414 912 | 296 147 | 426 665 |
| Maranhão | 151 412 | 45 763 | 39 466 | 28 582 | 37 601 |
| Piauí | 88 873 | 27 930 | 22 322 | 15 745 | 22 876 |
| Ceará | 260 224 | 80 370 | 68 051 | 44 415 | 67 388 |
| Rio Grande do Norte | 104 223 | 30 131 | 27 065 | 18 799 | 28 228 |
| Paraíba | 154 571 | 45 081 | 39 869 | 29 081 | 40 540 |
| Pernambuco | 304 097 | 95 571 | 77 711 | 55 964 | 74 851 |
| Alagoas | 85 441 | 27 386 | 21 081 | 15 436 | 21 538 |
| Sergipe | 55 088 | 16 412 | 13 631 | 9 760 | 15 285 |
| Bahia | 435 175 | 132 736 | 105 716 | 78 365 | 118 358 |
| Southeast | 2 760 298 | 941 048 | 698 752 | 477 973 | 642 525 |
| Minas Gerais | 644 801 | 214 886 | 162 803 | 113 231 | 153 881 |
| Espírito Santo | 91 870 | 31 842 | 22 657 | 15 206 | 22 165 |
| Rio de Janeiro | 681 789 | 232 501 | 170 725 | 117 022 | 161 541 |
| São Paulo | 1 341 838 | 461 819 | 342 567 | 232 514 | 304 938 |
| South | 923 343 | 314 256 | 234 107 | 164 823 | 210 157 |
| Paraná | 296 963 | 105 635 | 77 109 | 51 444 | 62 775 |
| Santa Catarina | 164 540 | 56 788 | 42 713 | 29 420 | 35 619 |
| Rio Grande do Sul | 461 840 | 151 833 | 114 285 | 83 959 | 111 763 |
| Central-West | 240 407 | 87 279 | 62 089 | 40 129 | 50 910 |
| Mato Grosso do Sul | 50 463 | 17 640 | 12 921 | 8 641 | 11 261 |
| Mato Grosso | 39 304 | 14 798 | 9 954 | 6 454 | 8 098 |
| Goiás | 115 015 | 41 550 | 30 048 | 19 225 | 24 192 |
| Federal District | 35 625 | 13 291 | 9 166 | 5 809 | 7 359 |
| 2000 | |||||
| Brazil | 8 002 245 | 2 447 720 | 1 941 781 | 1 512 973 | 2 099 771 |
| North | 351 491 | 115 817 | 87 044 | 61 368 | 87 262 |
| Rondônia | 32 045 | 11 941 | 8 589 | 5 430 | 6 085 |
| Acre | 14 308 | 4 621 | 3 396 | 2 663 | 3 628 |
| Amazonas | 70 148 | 22 989 | 17 485 | 12 266 | 17 408 |
| Roraima | 6 107 | 2 090 | 1 487 | 1 129 | 1 401 |
| Pará | 181 880 | 58 637 | 44 482 | 31 820 | 46 941 |
| Amapá | 9 970 | 3 270 | 2 485 | 1 630 | 2 585 |
| Tocantins | 37 033 | 12 269 | 9 120 | 6 430 | 9 214 |
| Northeast | 2 193 647 | 666 410 | 503 932 | 403 375 | 619 930 |
| Maranhão | 208 743 | 66 828 | 50 138 | 35 101 | 56 676 |
| Piauí | 125 823 | 39 384 | 29 692 | 23 326 | 33 421 |
| Ceará | 359 624 | 108 886 | 80 343 | 69 251 | 101 144 |
| Rio Grande do Norte | 136 475 | 40 009 | 29 061 | 25 851 | 41 554 |
| Paraíba | 194 726 | 57 367 | 41 855 | 36 470 | 59 034 |
| Pernambuco | 396 951 | 122 265 | 92 130 | 73 953 | 108 603 |
| Alagoas | 111 781 | 34 718 | 27 122 | 19 743 | 30 198 |
| Sergipe | 73 166 | 21 837 | 17 149 | 13 356 | 20 824 |
| Bahia | 586 358 | 175 116 | 136 442 | 106 324 | 168 476 |
| Southeast | 3 791 897 | 1 139 503 | 933 404 | 736 284 | 982 706 |
| Minas Gerais | 891 093 | 271 848 | 221 093 | 166 969 | 231 183 |
| Espírito Santo | 135 457 | 41 848 | 34 179 | 25 479 | 33 951 |
| Rio de Janeiro | 901 894 | 260 999 | 221 791 | 178 202 | 240 902 |
| São Paulo | 1 863 453 | 564 808 | 456 341 | 365 634 | 476 670 |
| South | 1 275 834 | 390 658 | 318 827 | 244 195 | 322 154 |
| Paraná | 428 326 | 137 889 | 109 796 | 80 248 | 100 393 |
| Santa Catarina | 236 085 | 74 273 | 58 571 | 45 097 | 58 144 |
| Rio Grande do Sul | 611 423 | 178 496 | 150 460 | 118 850 | 163 617 |
| Central-West | 389 376 | 135 332 | 98 574 | 67 751 | 87 719 |
| Mato Grosso do Sul | 78 325 | 25 799 | 19 681 | 13 832 | 19 013 |
| Mato Grosso | 67 132 | 24 425 | 17 249 | 11 331 | 14 127 |
| Goiás | 182 997 | 62 991 | 46 853 | 32 101 | 41 052 |
| Federal District | 60 922 | 22 117 | 14 791 | 10 487 | 13 527 |
Table 7
Persons aged 60 and above. heads of household, in absolute and relative numbers, by sex, according to Major Regions and Federation Units - 1991/2000
| 1991 | |||||
|---|---|---|---|---|---|
| Major Regions and Federation Units | Persons aged 60 and above, heads of household, by sex | ||||
| Absolute | Relative (%) | ||||
| Total | Men | Women | Men | Women | |
| Brazil | 6 396 502 | 4 357 281 | 2 039 221 | 68.1 | 31.9 |
| North | 274 474 | 200 282 | 74 192 | 73.0 | 27.0 |
| Rondônia | 26 168 | 21 423 | 4 745 | 81.9 | 18.1 |
| Acre | 12 491 | 9 136 | 3 355 | 73.1 | 26.9 |
| Amazonas | 50 646 | 36 400 | 14 246 | 71.9 | 28.1 |
| Roraima | 4 142 | 3 136 | 1 006 | 75.7 | 24.3 |
| Pará | 141 114 | 101 295 | 39 819 | 71.8 | 28.2 |
| Amapá | 6 653 | 4 579 | 2 074 | 68.8 | 31.2 |
| Tocantins | 33 260 | 24 313 | 8 947 | 73.1 | 26.9 |
| Northeast | 1 929 782 | 1 314 249 | 615 533 | 68.1 | 31.9 |
| Maranhão | 184 283 | 128 773 | 55 510 | 69.9 | 30.1 |
| Piauí | 106 904 | 74 380 | 32 524 | 69.6 | 30.4 |
| Ceará | 296 613 | 208 865 | 87 748 | 70.4 | 29.6 |
| Rio Grande do Norte | 119 536 | 85 232 | 34 304 | 71.3 | 28.7 |
| Paraíba | 177 977 | 123 284 | 54 693 | 69.3 | 30.7 |
| Pernambuco | 349 629 | 232 224 | 117 405 | 66.4 | 33.6 |
| Alagoas | 102 528 | 68 928 | 33 600 | 67.2 | 32.8 |
| Sergipe | 67 701 | 42 689 | 25 012 | 63.1 | 36.9 |
| Bahia | 524 611 | 349 874 | 174 737 | 66.7 | 33.3 |
| Southeast | 2 918 654 | 1 952 588 | 966 066 | 66.9 | 33.1 |
| Minas Gerais | 747 738 | 488 600 | 259 138 | 65.3 | 34.7 |
| Espírito Santo | 103 813 | 73 404 | 30 409 | 70.7 | 29.3 |
| Rio de Janeiro | 704 678 | 442 158 | 262 520 | 62.7 | 37.3 |
| São Paulo | 1 362 425 | 948 426 | 413 999 | 69.6 | 30.4 |
| Sul | 977 822 | 678 950 | 298 872 | 69.4 | 30.6 |
| Paraná | 335 465 | 244 428 | 91 037 | 72.9 | 27.1 |
| Santa Catarina | 171 973 | 123 591 | 48 382 | 71.9 | 28.1 |
| Rio Grande do Sul | 470 384 | 310 931 | 159 453 | 66.1 | 33.9 |
| Central-West | 295 770 | 211 212 | 84 558 | 71.4 | 28.6 |
| Mato Grosso do Sul | 61 964 | 46 344 | 15 620 | 74.8 | 25.2 |
| Mato Grosso | 52 369 | 41 107 | 11 262 | 78.5 | 21.5 |
| Goiás | 145 312 | 99 646 | 45 666 | 68.6 | 31.4 |
| Federal District | 36 125 | 24 115 | 12 010 | 66.8 | 33.2 |
| 2000 | |||||
| Brazil | 8 964 850 | 5 594 347 | 3 370 503 | 62.4 | 37.6 |
| North | 433 397 | 291 281 | 142 116 | 67.2 | 32.8 |
| Rondônia | 44 819 | 33 948 | 10 871 | 75.7 | 24.3 |
| Acre | 19 701 | 13 263 | 6 438 | 67.3 | 32.7 |
| Amazonas | 81 805 | 52 705 | 29 100 | 64.4 | 35.6 |
| Roraima | 7 864 | 5 498 | 2 366 | 69.9 | 30.1 |
| Pará | 216 717 | 143 220 | 73 497 | 66.1 | 33.9 |
| Amapá | 11 632 | 7 231 | 4 401 | 62.2 | 37.8 |
| Tocantins | 50 859 | 35 416 | 15 443 | 69.6 | 30.4 |
| Northeast | 2 552 933 | 1 584 275 | 968 658 | 62.1 | 37.9 |
| Maranhão | 255 552 | 166 437 | 89 115 | 65.1 | 34.9 |
| Piauí | 150 166 | 97 688 | 52 478 | 65.1 | 34.9 |
| Ceará | 403 921 | 259 354 | 144 567 | 64.2 | 35.8 |
| Rio Grande do Norte | 153 028 | 98 480 | 54 548 | 64.4 | 35.6 |
| Paraíba | 218 119 | 135 785 | 82 334 | 62.3 | 37.7 |
| Pernambuco | 448 459 | 265 923 | 182 536 | 59.3 | 40.7 |
| Alagoas | 131 339 | 80 077 | 51 262 | 61.0 | 39.0 |
| Sergipe | 87 793 | 50 776 | 37 017 | 57.8 | 42.2 |
| Bahia | 704 556 | 429 755 | 274 801 | 61.0 | 39.0 |
| Southeast | 4 109 003 | 2 515 157 | 1 593 846 | 61.2 | 38.8 |
| Minas Gerais | 1 039 986 | 640 985 | 399 001 | 61.6 | 38.4 |
| Espírito Santo | 153 651 | 98 804 | 54 847 | 64.3 | 35.7 |
| Rio de Janeiro | 960 893 | 538 098 | 422 795 | 56.0 | 44.0 |
| São Paulo | 1 954 473 | 1 237 270 | 717 203 | 63.3 | 36.7 |
| South | 1 387 258 | 886 067 | 501 191 | 63.9 | 36.1 |
| Paraná | 490 921 | 327 036 | 163 885 | 66.6 | 33.4 |
| Santa Catarina | 252 056 | 167 473 | 84 583 | 66.4 | 33.6 |
| Rio Grande do Sul | 644 281 | 391 558 | 252 723 | 60.8 | 39.2 |
| Central-West | 482 259 | 317 567 | 164 692 | 65.8 | 34.2 |
| Mato Grosso do Sul | 95 584 | 65 418 | 30 166 | 68.4 | 31.6 |
| Mato Grosso | 87 624 | 63 523 | 24 101 | 72.5 | 27.5 |
| Goiás | 231 980 | 148 884 | 83 096 | 64.2 | 35.8 |
| Federal District | 67 071 | 39 742 | 27 329 | 59.3 | 40.7 |
Source: Censo demográfico 1991: resultados do universo: microdados, Rio de Janeiro: IBGE, 2002, 21 CD-ROM; IBGE, Censo Demográfico 2000.
Note: Permanent private households.
Table 11
Resident population, total and aged 60 and above, by sex and age groups, by Major REgions and Federation Units - 1991/2000
| Major Regions and Federation Units | Average monthly nominal revenue of persons aged 60 and above, heads of household, by rural or urban area (R$) |
|||||
|---|---|---|---|---|---|---|
| 1991 (1) | 2000 (2) | |||||
| Total | Urban | Rural | Total | Urban | Rural | |
| Brazil | 403.00 | 477.00 | 168.00 | 657.00 | 739.00 | 297.00 |
| North | 300.00 | 364.00 | 197.00 | 438.00 | 502.00 | 280.00 |
| Rondônia | 248.00 | 295.00 | 185.00 | 423.00 | 440.00 | 395.00 |
| Acre | 303.00 | 353.00 | 192.00 | 433.00 | 493.00 | 280.00 |
| Amazonas | 365.00 | 423.00 | 208.00 | 485.00 | 562.00 | 212.00 |
| Roraima | 432.00 | 483.00 | 284.00 | 470.00 | 537.00 | 253.00 |
| Pará | 302.00 | 374.00 | 204.00 | 444.00 | 523.00 | 266.00 |
| Amapá | 382.00 | 417.00 | 232.00 | 514.00 | 547.00 | 275.00 |
| Tocantins | 207.00 | 243.00 | 159.00 | 328.00 | 339.00 | 299.00 |
| Northeast | 224.00 | 298.00 | 115.00 | 386.00 | 474.00 | 198.00 |
| Maranhão | 156.00 | 178.00 | 139.00 | 287.00 | 349.00 | 187.00 |
| Piauí | 193.00 | 280.00 | 103.00 | 332.00 | 413.00 | 200.00 |
| Ceará | 227.00 | 300.00 | 107.00 | 401.00 | 493.00 | 196.00 |
| Rio Grande do Norte | 227.00 | 282.00 | 112.00 | 433.00 | 509.00 | 224.00 |
| Paraíba | 192.00 | 247.00 | 100.00 | 367.00 | 440.00 | 199.00 |
| Pernambuco | 273.00 | 343.00 | 114.00 | 453.00 | 532.00 | 201.00 |
| Alagoas | 216.00 | 280.00 | 118.00 | 402.00 | 491.00 | 199.00 |
| Sergipe | 231.00 | 294.00 | 121.00 | 398.00 | 491.00 | 197.00 |
| Bahia | 230.00 | 325.00 | 115.00 | 373.00 | 475.00 | 197.00 |
| Southeast | 536.00 | 576.00 | 224.00 | 835.00 | 879.00 | 398.00 |
| Minas Gerais | 340.00 | 394.00 | 180.00 | 590.00 | 650.00 | 338.00 |
| Espírito Santo | 337.00 | 382.00 | 211.00 | 638.00 | 702.00 | 393.00 |
| Rio de Janeiro | 640.00 | 660.00 | 191.00 | 1 018.00 | 1 042.00 | 359.00 |
| São Paulo | 606.00 | 624.00 | 342.00 | 893.00 | 913.00 | 531.00 |
| South | 382.00 | 438.00 | 221.00 | 661.00 | 730.00 | 399.00 |
| Paraná | 362.00 | 415.00 | 210.00 | 620.00 | 675.00 | 385.00 |
| Santa Catarina | 323.00 | 368.00 | 214.00 | 631.00 | 702.00 | 405.00 |
| Rio Grande do Sul | 417.00 | 478.00 | 232.00 | 703.00 | 782.00 | 407.00 |
| Central-West | 440.00 | 477.00 | 279.00 | 754.00 | 789.00 | 546.00 |
| Mato Grosso do Sul | 390.00 | 408.00 | 312.00 | 630.00 | 649.00 | 517.00 |
| Mato Grosso | 314.00 | 333.00 | 258.00 | 544.00 | 562.00 | 478.00 |
| Goiás | 349.00 | 371.00 | 263.00 | 579.00 | 586.00 | 540.00 |
| Federal District | 1 060.00 | 1 092.00 | 461.00 | 1 796.00 | 1 813.00 | 1 326.00 |
Source: Censo demográfico 1991: resultados do universo: microdados. Rio de Janeiro: IBGE, 2002. 21 CD-ROM; IBGE, Censo Demográfico 2000.
Note: Permanent private households.
(1) Valued deflated by the INPC having July 2000 as base.
(2) Except for persons without income.
Table 13
Proportion of persons aged 60and above. heads of household. bu tyoe of household and age groups of children in the household. according to Major Regions and Federation Units - 1991/2000
| Major Regions and Federation Units | Persons aged 60 and above. heads of household | ||||||
|---|---|---|---|---|---|---|---|
| Total | Type of household (%) | ||||||
| One-person | Where children live | ||||||
| Total | Age group of children | ||||||
| 0 to 6 years old | 7 to 14 years old | 15 to 17 years old | 18 years old and above | ||||
| 1991 | |||||||
| Brazil | 6 396 502 | 15.4 | 56.7 | 5.1 | 11.6 | 10.2 | 50.3 |
| North | 274 474 | 10.7 | 67.3 | 10.0 | 22.1 | 18.0 | 56.4 |
| Rondônia | 26 168 | 13.3 | 62.9 | 8.9 | 21.8 | 19.1 | 50.8 |
| Acre | 12 491 | 13.9 | 62.8 | 11.2 | 23.9 | 17.9 | 49.4 |
| Amazonas | 50 646 | 8.5 | 73.1 | 11.8 | 25.6 | 20.0 | 61.5 |
| Roraima | 4 142 | 12.2 | 65.6 | 12.5 | 25.1 | 18.3 | 51.3 |
| Pará | 141 114 | 10.0 | 67.8 | 9.4 | 20.8 | 17.2 | 57.6 |
| Amapá | 6 653 | 9.8 | 70.2 | 12.0 | 24.4 | 20.0 | 59.6 |
| Tocantins | 33 260 | 14.0 | 61.0 | 9.4 | 21.1 | 17.3 | 50.1 |
| Northeast | 1 929 782 | 13.9 | 60.8 | 7.5 | 16.8 | 13.9 | 51.4 |
| Maranhão | 184 283 | 11.9 | 60.7 | 10.3 | 21.6 | 15.7 | 48.4 |
| Piauí | 106 904 | 11.7 | 63.5 | 7.7 | 18.1 | 15.3 | 53.8 |
| Ceará | 296 613 | 10.8 | 64.3 | 7.2 | 16.3 | 13.3 | 55.1 |
| Rio Grande do Norte | 119 536 | 11.6 | 63.5 | 6.6 | 15.4 | 13.1 | 55.2 |
| Paraíba | 177 977 | 13.7 | 59.9 | 6.4 | 15.2 | 13.3 | 51.1 |
| Pernambuco | 349 629 | 14.8 | 60.3 | 6.8 | 15.4 | 13.1 | 51.1 |
| Alagoas | 102 528 | 14.9 | 61.1 | 8.7 | 18.6 | 14.8 | 50.3 |
| Sergipe | 67 701 | 18.8 | 56.0 | 7.1 | 15.0 | 12.8 | 47.8 |
| Bahia | 524 611 | 16.0 | 58.8 | 7.6 | 16.7 | 14.4 | 50.1 |
| Southeast | 2 918 654 | 16.5 | 54.4 | 3.4 | 8.1 | 7.7 | 50.1 |
| Minas Gerais | 747 738 | 15.8 | 60.6 | 4.2 | 10.7 | 10.4 | 55.4 |
| Espírito Santo | 103 813 | 13.2 | 61.4 | 5.2 | 12.7 | 11.8 | 55.0 |
| Rio de Janeiro | 704 678 | 18.2 | 51.6 | 3.4 | 7.2 | 6.5 | 47.6 |
| São Paulo | 1 362 425 | 16.3 | 51.9 | 2.8 | 6.7 | 6.4 | 48.2 |
| South | 977 822 | 16.3 | 52.0 | 3.7 | 8.4 | 7.9 | 46.9 |
| Paraná | 335 465 | 15.1 | 55.0 | 4.4 | 10.2 | 9.8 | 49.1 |
| Santa Catarina | 171 973 | 13.7 | 55.2 | 4.0 | 9.0 | 8.8 | 49.9 |
| Rio Grande do Sul | 470 384 | 18.0 | 48.8 | 3.0 | 6.8 | 6.2 | 44.3 |
| Central-West | 295 770 | 15.7 | 57.9 | 5.4 | 13.2 | 12.1 | 50.6 |
| Mato Grosso do Sul | 61 964 | 15.0 | 55.9 | 5.7 | 13.6 | 12.1 | 48.1 |
| Mato Grosso | 52 369 | 13.6 | 62.4 | 7.6 | 18.3 | 16.2 | 52.9 |
| Goiás | 145 312 | 17.7 | 55.5 | 4.6 | 11.4 | 10.7 | 49.1 |
| Distrito Federal | 36 125 | 11.9 | 64.4 | 4.9 | 12.8 | 11.3 | 57.7 |
| 2000 | |||||||
| Brazil | 8 964 850 | 17.9 | 54.5 | 2.3 | 6.7 | 6.2 | 49.7 |
| North | 433 397 | 12.2 | 65.4 | 5.3 | 14.4 | 12.3 | 57.4 |
| Rondônia | 44 819 | 16.1 | 55.8 | 3.8 | 11.5 | 10.4 | 47.5 |
| Acre | 19 701 | 15.9 | 60.9 | 6.7 | 16.5 | 12.6 | 49.9 |
| Amazonas | 81 805 | 9.9 | 71.7 | 6.7 | 16.6 | 14.2 | 64.0 |
| Roraima | 7 864 | 15.7 | 61.1 | 6.0 | 16.7 | 13.2 | 50.8 |
| Pará | 216 717 | 10.9 | 67.3 | 5.1 | 14.1 | 12.1 | 59.5 |
| Amapá | 11 632 | 11.1 | 70.3 | 6.6 | 17.1 | 14.5 | 61.9 |
| Tocantins | 50 859 | 16.1 | 57.4 | 4.2 | 12.7 | 10.9 | 49.0 |
| Northeast | 2 552 933 | 14.8 | 60.6 | 3.6 | 10.7 | 9.5 | 53.6 |
| Maranhão | 255 552 | 11.8 | 62.1 | 5.3 | 15.6 | 13.1 | 52.1 |
| Piauí | 150 166 | 12.5 | 62.6 | 3.6 | 12.1 | 10.9 | 54.8 |
| Ceará | 403 921 | 12.4 | 63.3 | 4.1 | 11.5 | 9.5 | 55.9 |
| Rio Grande do Norte | 153 028 | 13.2 | 62.5 | 2.9 | 9.4 | 8.3 | 56.5 |
| Paraíba | 218 119 | 15.3 | 58.8 | 2.8 | 8.9 | 8.2 | 52.6 |
| Pernambuco | 448 459 | 15.8 | 60.1 | 3.1 | 9.1 | 8.0 | 53.7 |
| Alagoas | 131 339 | 15.1 | 61.2 | 4.8 | 12.0 | 10.0 | 53.4 |
| Sergipe | 87 793 | 18.2 | 57.9 | 3.4 | 9.3 | 8.2 | 51.7 |
| Bahia | 704 556 | 16.9 | 58.8 | 3.3 | 10.0 | 9.5 | 52.5 |
| Southeast | 4 109 003 | 19.5 | 52.2 | 1.4 | 4.3 | 4.2 | 48.9 |
| Minas Gerais | 1 039 986 | 18.0 | 57.6 | 1.8 | 5.9 | 6.1 | 53.6 |
| Espírito Santo | 153 651 | 16.8 | 56.0 | 1.9 | 6.5 | 6.3 | 51.1 |
| Rio de Janeiro | 960 893 | 21.7 | 49.4 | 1.3 | 3.6 | 3.2 | 46.2 |
| São Paulo | 1 954 473 | 19.4 | 50.4 | 1.2 | 3.5 | 3.6 | 47.6 |
| South | 1 387 258 | 20.3 | 47.2 | 1.4 | 4.5 | 4.3 | 43.1 |
| Paraná | 490 921 | 18.9 | 49.4 | 1.7 | 5.3 | 4.9 | 44.9 |
| Santa Catarina | 252 056 | 17.9 | 49.1 | 1.5 | 4.7 | 4.5 | 45.0 |
| Rio Grande do Sul | 644 281 | 22.4 | 44.8 | 1.2 | 3.8 | 3.6 | 41.1 |
| Central-West | 482 259 | 19.0 | 52.8 | 2.1 | 6.4 | 5.9 | 47.7 |
| Mato Grosso do Sul | 95 584 | 18.9 | 50.5 | 2.3 | 7.0 | 6.1 | 44.8 |
| Mato Grosso | 87 624 | 17.2 | 55.5 | 2.8 | 8.9 | 7.9 | 49.1 |
| Goiás | 231 980 | 21.1 | 49.9 | 1.8 | 5.3 | 5.0 | 45.3 |
| Federal District | 67 071 | 14.3 | 62.7 | 2.1 | 5.9 | 6.0 | 58.2 |
Source: Censo demográfico 1991: resultados do universo: microdados. Rio de Janeiro: IBGE. 2002. 21 CD-ROM; IBGE. Censo Demográfico 2000.
Note: Permanent private households.
Result tables (in excel)
Table 22
Average years of schooling of persons aged 60 and above, heads of household, by sex, according to Major Regions and Federation Units - 1991/2000
| Major Regions and Federation Units | Average years of schooling of persons aged 60 and above, heads of household | ||
|---|---|---|---|
| Total | Sex | ||
| Men | Women | ||
| 1991 | |||
| Brazil | 2.7 | 2.8 | 2.4 |
| North | 1.9 | 1.9 | 1.7 |
| Rondônia | 1.5 | 1.5 | 1.2 |
| Acre | 1.6 | 1.7 | 1.5 |
| Amazonas | 2.2 | 2.2 | 2.1 |
| Roraima | 2.0 | 2.0 | 1.8 |
| Pará | 2.0 | 2.1 | 1.9 |
| Amapá | 1.8 | 2.0 | 1.3 |
| Tocantins | 1.0 | 1.1 | 0.6 |
| Northeast | 1.4 | 1.4 | 1.4 |
| Maranhão | 1.0 | 1.1 | 1.0 |
| Piauí | 1.1 | 1.1 | 1.0 |
| Ceará | 1.5 | 1.4 | 1.6 |
| Rio Grande do Norte | 1.4 | 1.3 | 1.5 |
| Paraíba | 1.2 | 1.2 | 1.3 |
| Pernambuco | 1.8 | 1.9 | 1.7 |
| Alagoas | 1.2 | 1.2 | 1.2 |
| Sergipe | 1.4 | 1.4 | 1.3 |
| Bahia | 1.4 | 1.4 | 1.2 |
| Southeast | 3.6 | 3.8 | 3.1 |
| Minas Gerais | 2.5 | 2.6 | 2.2 |
| Espírito Santo | 2.4 | 2.5 | 2.0 |
| Rio de Janeiro | 4.8 | 5.3 | 4.1 |
| São Paulo | 3.7 | 3.9 | 3.2 |
| South | 3.0 | 3.1 | 2.7 |
| Paraná | 2.5 | 2.6 | 2.3 |
| Santa Catarina | 2.9 | 3.0 | 2.6 |
| Rio Grande do Sul | 3.3 | 3.5 | 3.0 |
| Central-West | 2.4 | 2.5 | 2.0 |
| Mato Grosso do Sul | 2.1 | 2.2 | 1.8 |
| Mato Grosso | 1.8 | 1.9 | 1.6 |
| Goiás | 2.0 | 2.2 | 1.6 |
| Federal Disrict | 5.0 | 5.6 | 3.9 |
| 2000 | |||
| Brazil | 3.4 | 3.5 | 3.1 |
| North | 2.4 | 2.4 | 2.4 |
| Rondônia | 1.9 | 2.0 | 1.8 |
| Acre | 2.0 | 1.9 | 2.1 |
| Amazonas | 2.7 | 2.7 | 2.8 |
| Roraima | 2.4 | 2.4 | 2.4 |
| Pará | 2.6 | 2.5 | 2.6 |
| Amapá | 2.6 | 2.8 | 2.2 |
| Tocantins | 1.5 | 1.6 | 1.3 |
| Northeast | 2.0 | 2.0 | 2.1 |
| Maranhão | 1.5 | 1.5 | 1.6 |
| Piauí | 1.6 | 1.6 | 1.6 |
| Ceará | 2.1 | 1.9 | 2.3 |
| Rio Grande do Norte | 2.1 | 2.0 | 2.3 |
| Paraíba | 1.9 | 1.9 | 2.1 |
| Pernambuco | 2.5 | 2.6 | 2.5 |
| Alagoas | 1.9 | 1.8 | 1.9 |
| Sergipe | 2.1 | 2.1 | 2.0 |
| Bahia | 2.0 | 2.0 | 1.9 |
| Southeast | 4.3 | 4.6 | 3.8 |
| Minas Gerais | 3.1 | 3.3 | 2.9 |
| Espírito Santo | 3.1 | 3.3 | 2.8 |
| Rio de Janeiro | 5.4 | 5.9 | 4.7 |
| São Paulo | 4.4 | 4.7 | 3.8 |
| South | 3.7 | 3.8 | 3.4 |
| Paraná | 3.2 | 3.3 | 2.9 |
| Santa Catarina | 3.7 | 3.9 | 3.4 |
| Rio Grande do Sul | 4.1 | 4.2 | 3.8 |
| Central-West | 3.2 | 3.3 | 2.9 |
| Mato Grosso do Sul | 2.8 | 3.0 | 2.5 |
| Mato Grosso | 2.5 | 2.5 | 2.4 |
| Goiás | 2.7 | 2.9 | 2.4 |
| Federal District | 6.0 | 6.7 | 5.0 |
Source: Censo demográfico 1991: resultados do universo: microdados. Rio de Janeiro: IBGE. 2002. 21 CD-ROM; IBGE. Censo Demográfico 2000.
Note: Permanent private households.
Municipal tables (excel)
The IBGE adopts a review policy of the data disclosed by this statistical operation. Data review means any and all scheduled revision of numerical data due to new information, which was not accessible at the time of the first disclosure. For instance: late data that replaces a non-response; or data corrected by the informant himself; or a set of data that has undergone editing and imputation. For more detailed information about the published data review policy of the IBGE statistical operations, check the list of short-term, long-term and special surveys carried out by the Institute with their respective revision procedure on: https://biblioteca.ibge.gov.br/index.php/biblioteca-catalogo?view=detalhes&id=298009.
Publications - Profile of Elderly Heads of Household in Brazil
Description
It is the major reference source to know the life conditions of the population in all the municipalities of Brazil and in their internal territorial divisions, having the resident person in the housing unit in the National Territory in the reference date as the data collection unit.
The Basic Questionnaire of the survey investigates information on the characteristics of the housing units (urban or rural status, number of bathrooms, existence of toilet, drainage of the bathroom or toilet, water supply, garbage disposal, existence of electricity, etc.); international emigration; composition of the housing units (number of residents, shared responsibility, list of residents, identification of the head, family relationship with the head of the household, etc.); characteristics of residents (sex and age, color or race, ethnicity and spoken language, in the case of Indians, ownership of birth registration, literacy, monthly earnings, etc.); and mortality. Selected housing units were investigated through the Sample Questionnaire, which includes more detailed items on the characteristics of the housing unit and residents in addition to those present in the Basic Questionnaire, as well as items on specific themes like disability, nuptiality and fertility.
The periodicity of the survey is decennial, except for the years of 1910 and 1930, in which the survey was canceled, and of 1990, whose operation was postponed to 1991.
The geographic coverage is nationwide, with results released for Brazil, Major Regions, Federation Units, Mesoregions, Microregions, Metropolitan Areas, Municipalities, Districts, Sub-districts and Enumeration Areas.
Historical Overview
The first population census in Brazil was carried out in 1808, specifically aiming at military interests of recruiting for the Armed Forces. It caused the suspect that its results would have been far from reality, due either to the natural prevention of the population against census operations or, mainly, to its objectives. For historical purposes, the census carried out in 1872, called General Census of the Empire, is considered the first one in Brazil, due to its bigger complexity and, above all, to the control exerted on the whole operation. It was established by Decree no. 4,856, of December 30, 1871, and conducted by the General Directorate of Statistics, later discontinued in 1879. The census scheduled for 1880 was transferred to 1887, eventually remaining just as a project. The General Directorate of Statistics was reestablished by Decree no. 113-d, of January 2, 1890, which set the date of December 31, 1890 to carry out the I Census of the Republic. The II Decennial Census of the Republic began on December 31, 1900 in the entire Brazilian territory. Nevertheless, problems with the calculation of the data in the city of Rio de Janeiro, then Federal District, caused the appointment of a commission to study this issue, which concluded to cancel the results related to the city. Based on a legal provision towards this aim, the Federal District carried out another survey just in 1906, completed in February 1907 and released in a special volume. Scheduled for December 31, 1910, the III Decennial Census of the Republic was transferred to June 30, 1911. The operation was definitively discontinued as a result of the political turmoil that Brazil was facing at the time. Carried out on September 1, 1920, the IV Decennial Census aimed at not only the population, yet also the economic situation of the localities. As a result, the industrial and agricultural production in Brazil were thoroughly investigated. Considering the decennial periodicity of the Brazilian censuses as established by law, the V General Census of Brazil should had taken place in 1930, yet a number of reasons, particularly those of political nature, hindered the operation that year. After the radical transformation of the statistical services in Brazil – creation of the National Council of Statistics - CNE and National Council of Geography - CNG, which, altogether, formed the IBGE, according to Decree-Law no. 218, of January 26, 1938 –, the V General Census of Brazil was carried out in 1940, corresponding to the fifth population census, second agricultural and industrial census, and first surveying on trade, transportation, communications and services. Carried out in 1950, the VI General Census of Brazil included the Population Census, whose reference date was fixed on July 1st, and the Agricultural, Industrial, Trade and Services Censuses, as well as the special surveys on transportation and communications. That census integrated the Census of the Americas, sponsored by the Inter-American Statistical Institute - IASI, addressing a specific request from the United Nations - UN. Held on September 1, 1960, the VII General Census of Brazil also followed the basic guidelines established by those international organizations, in order to assure the consistency of the concepts and allow the comparability of the census results among the American nations. In this survey, the sampling technique was used for the first time in a Brazilian census. Integrated with the Census of the Americas, the VIII General Census of Brazil was carried out on September 1, 1970, encompassing the Population Census and the Property, Agricultural, Industrial, Trade and Services Censuses, as well as special surveys on credit institutions, insurance companies and companies in charge of producing and distributing electricity. The IBGE carried out the IX General Census of Brazil on September 1, 1980, which included not only the Population Census, yet also the Agricultural, Industrial, Trade and Services Censuses and, after previous surveys, integrated with the Census of the Americas, as suggested by the UN. That survey counted on technological advances that allowed innovations in the operation and dissemination of results, which were published in the same year of the operation for the first time ever. Due to budget restrictions, the Population Census was not carried out in 1990, being postponed to September 1, 1991. Compared with the previous censuses, the 1991 Population Census innovated in a number of technical, technological and operational aspects, highlighting also the institution of partnerships – Municipal Census Commissions - CCMs and the Advisory Commission –, which worked as a link between the IBGE and the society. The 2000 Population Census, which resumed the operation in years ending in zero, anticipated the reference date of the survey from September 1st to August 1st, and represented a qualitative leap in a number of aspects, particularly concerning the technological innovation – from the system that followed up the data collection to the data capture and to the automation of the processes of data coding, edit and tabulation, through the extensive use of digital technologies, providing the most appropriate media to each segment of users. Its implementation consolidated the statistical bonds among the countries of the Extended Mercosur, which also includes Argentina, Paraguay, Uruguay, Bolivia and Chile. Carried out on August 1st, the 2010 Population Census made important transformations in the work methods, providing users with even more interactive and specialized pictures, characterized by relevant methodological improvements and technological advances. Partnerships were improved and strengthened through the State Census Commissions - CCEs and Municipal Commissions of Geography and Statistics - CMGEs, aiming at expanding the integration between the IBGE and the local communities to gather cooperation and logistics support for the implementation of institutional surveys.
Time series
#tabelasidra2018731246098
#seriehistorica20187312484678
#seriehistorica201873125221541
#seriehistorica20187312541828
...
Microdata
The microdata are the lowest level of disaggregation of the data of a survey, representing, in the form of numerical codes, the content of the questionnaires and preserving the statistical confidentiality aiming at the non-individualization of the information. The microdata are in ASCII format, allowing expert users with knowledge in programming, preferably in statistical software, to read the data, cross them in different geographic aggregations and create multiple tabulations according to their personal interest.
The microdata files are coupled with a support documentation that provides the names, codes and descriptions of the variables and their categories, complemented, whenever needed, with elements to compute the sampling errors.
2010 Census
Updating
March 11, 2016 - Variable v1005 - ENUMERATION AREA STATUS was included in the HOUSING UNIT, PERSON, EMIGRATION and MORTALITY files
Federation Units
Tables - Federation Units and Municipalities (in zip format)
- Rondônia
- Acre
- Amazonas
- Roraima
- Pará
- Amapá
- Tocantins
- Maranhão
- Piauí
- Ceará
- Rio Grande do Norte
- Paraíba
- Pernambuco
- Alagoas
- Sergipe
- Bahia
- Minas Gerais
- Espírito Santo
- Rio de Janeiro
- São Paulo - except MA
- São Paulo - MA
- Paraná
- Santa Catarina
- Rio Grande do Sul
- Mato Grosso do Sul
- Mato Grosso
- Goiás
- Federal District
- Microdata for the 14 municipalities with redesigned areas
- updated on March 31, 2016 - variable v1005 - ENUMERATION AREA STATUS was included in the Variable description files - Microdata of the sample of the 2010 Population Census - updated on March 15, 2016
- variable v1005 - ENUMERATION AREA STATUS was included in the Layout_microdados_Amostra_14_munic_20160301 file, in the sub-folders of HOUSING UNIT, PERSON, EMIGRATION and MORTALITY
2000 Census
Updating
September 8, 2017 - It was detected that variable V0300 was not in the housing unit file.
March 9, 2016 - It was detected that the activity and employment files were incomplete and that it was necessary to include new codes in the documentation that matches the codes of 2000 and 1991.
June 19, 2015 - It was detected that parts of some records were corrupted. The files were replaced.
Federation Units
Downloads
Technical Information
Methodology of the survey carried out in 2010 (Methodological Reports Series, v. 41)
Methodology of the survey carried out in 2000 (Methodological Reports Series, v. 25)
Methodology of the survey carried out in 1980 (Methodological Reports Series, v. 4)
The changes that took place in the survey after the release of the methodological reports are presented either as Technical notes and/or Methodological notes. The technical notes either report or clarify specific issues on the survey, whereas the methodological notes address general aspects of the improvements, updates and/or revisions implemented, as well as complementary methodological aspects, whose clarifications have been made necessary before the release of a new formal volume of the Methodological Reports Series.
Technical notes
- Technical note 01/2018 - Reinterpretation of the data on disabled persons in the 2010 Population Census, in the light of the recommendations of the Washington Group
News and Releases
2022 Census
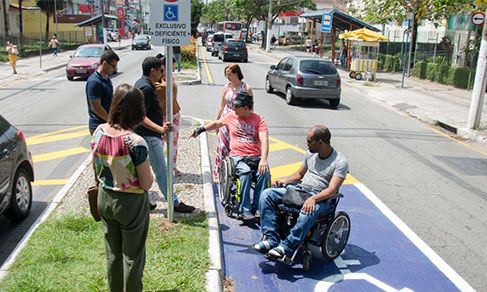
2022 Census: two out of three Brazilians were residents of roads without wheelchair ramps
Data found in the 2022 Census show that, of the 174.2 million residents of areas with urban characteristics...
17/04/2025
2022 Census
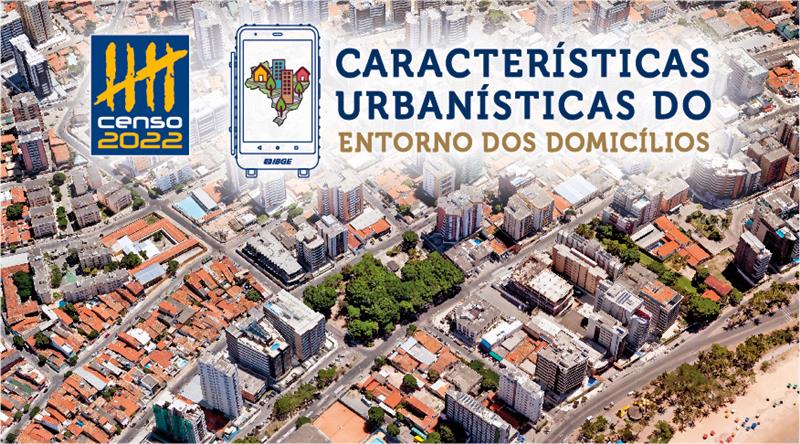
In Maceió (AL), IBGE releases urban characteristics of surroundings of housing units
On April 17, at 10 am, in Maceió (AL), the Brazilian Institute of Geography and Statistics (IBGE) will...
03/04/2025
2022 Census
2022 Census: proportion of population with complete higher education increases from 6.8% in 2000 to 18.4% in 2022
Between 2000 and 2022, the proportion of persons with complete higher education grew 2.7 times in the...
26/02/2025

2022 Census
2022 Census: Brazil has 8.5 thousand Indigenous localities, most of them in the North Region
According with Census data, published today (19) by the IBGE, there were 8,568 Indigenous localities...
19/12/2024

2022 Census
2022 Census: one out of five Brazilians lives in rented household
In 2022, the proportion of Brazilians who lived in rented households maintained the upward trend and...
12/12/2024

2022 Census
2022 Census: At Casa Brasil IBGE, technical team releases aggregated results by enumeration areas and enumeration routes
The Brazilian Institute of Geography and Statistics (IBGE) released, on Thursday, 14, data relative to...
14/11/2024
2022 Census
2022 Census: 87% of the Brazilian population lives in urban areas
According to the 2022 Population Census, of the total country's population, 203.1 million people, 177.5...
14/11/2024

2022 Census
IBGE launches Environment and Maps Modules for the Creating Synergies between the 2030 Agenda and the G20 series
The Brazilian Institute of Geography and Statistics (IBGE) is releasing the Environment and Maps thematic...
14/11/2024

2022 Census
2022 Census: IBGE releases data on the Census Map at Casa Brasil IBGE
On November 14, at 10 am, the Brazilian Institute of Geography and Statistics (IBGE) will releases the...
12/11/2024

2022 Census
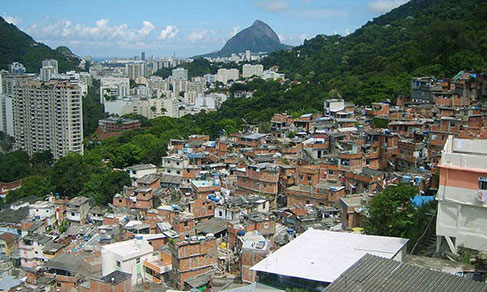
2022 Census: 16.4 million persons in Brazil lived in Favelas and Urban Communities
The 2022 Population Census found 12,348 Favelas and Urban Communities in Brazil, inhabited by 16,390,815...
08/11/2024
Errata
Correction of files in the product Aggregated resuts by enumeration areas
Published date: 17/04/2025
Description:
Necessary corrections were made in the mesh of Enumeration Areas, causing the relocation of 18 housing units to a different enumeration area in the file “Agregados_por_setores_basico_BR.zip”. Variable V00003 had its name corrected from “Domicílios Coletivos Com Morador” to “Unidades de Habitação em Domicílios Coletivos Com Morador” in the file “Dicionário de dados”. Other 15 blank variables - V00236, V00243, V00250, V00257, V00280, V00281, V00282, V00283, V00284, V00303, V00304, V00556, V00563, V00570 and V00577 - were corrected in the files “Agregados_por_setores_caracteristicas_domicilios2.zip” and “Agregados_por_setores_caracteristicas_domicilios3.zip”.Actions: Replacement of files available for download on the release page an in the Methodological note no. 06/2024.
Replacement of publication Methodological notes no.07/2024: Sample expansion process for preliminary results
Published date: 30/01/2025
Description:
The amendment of the title of the methodological note referenced on page 11 of the publication was required.Actions: The publication has been replaced and the title of the methodological note, which talks about the construction of preliminary weighting areas, has been changed.
Correction of data in two graphs of the topic Indigenous peoples on the 2022 Census Overview website
Published date: 09/10/2024
Description:
The graphs "Population in indigenous lands" and "Indigenous lands by location of housing unit" of the 2022 Census Overview website presented incorrect data in the period between September 26 and October 04, 2024.Actions: The error was corrected on the 2022 Census Overview website in the afternoon of October 04.
Replacement of the publication 2022 Population Census: Indigenous Population: Literacy, birth records and characteristics of housing units, by specific areas: Population Results
Published date: 08/10/2024
Description:
Correction of two pieces of data in the last paragraph of page 42 of the complete publication. Instead of 24 municipalities, there are 25 where the proportion of the population living in housing units with a bathroom for exclusive use in 2022 was below 50% and, instead of 668 municipalities, there are 669 where this proportion was below 90%.
Five pieces of data on pages 164, 202, 218 and 219 of the publication were corrected. On page 164, the figure informed was 621 079 housing units, while the correct figure is 342 080 housing units. On page 202, the figure informed was 621 079 housing units, but the right figure is 516 176 housing units. On pages 218 and 219, percent changes were corrected from 9.42% to 9.39%; from 34.70% to 34.71%; and from 0.55% to 0.56%.Actions: The complete publication was replaced.
Replacement of 2022 Population Census: Characteristics of housing units: Population results publication
Published date: 05/06/2024
Description:
Amendment of two data in the last paragraph of page 42 of the complete publication. Instead of 24 municipalities, they are 25 in which the proportion of the population living in housing units with exclusive bathrooms in 2022 was lower than 50%, and, instead of 668 municipalities, they are 669 in which this proportion was lower than 90%.
Actions: The complete publication has been replaced.Error in release "Population and households - First results", specifically in results of municipalities Abel Figueiredo (PA) and São Pedro da Água Branca (MA)
Published date: 22/12/2023
Description:
Error in the data collection, pinpointed by the IBGE, in the inter-state border between Pará and Maranhão, in the municipalities of Abel Figueiredo (PA) and São Pedro da Água Branca (MA). The amendment caused the transference of a contingent of 894 persons and 330 households, being 265 occupied households with interviews from Abel Figueiredo (PA) to São Pedro da Água Branca (MA).Actions:
Tables SIDRA 4709, 4711, 4712 e 4714 of the "Population and Households -First Results" release with the amendments were made available on December 22, 2023.Observation:
The IBGE is producing a Technical Note, to be released soon, detailing this problem and showing all the actions aiming at its amendment.Error in release "Population by age and sex - Results of the universe", specifically in results of municipalities Abel Figueiredo (PA) and São Pedro da Água Branca (MA)
Published date: 22/12/2023
Description:
Error in the data collection, pinpointed by the IBGE, in the inter-state border between Pará and Maranhão, in the municipalities of Abel Figueiredo (PA) and São Pedro da Água Branca (MA). The amendment caused the transference of a contingent of 894 persons from Abel Figueiredo (PA) to São Pedro da Água Branca (MA).Actions:
Tables SIDRA 1209, 9514 e 9515 of the "Population by age and sex - Results of the Universe" release with the amendments were made available on December 22, 2023.Observation:
The IBGE is producing a Technical Note, to be released soon, detailing this problem and showing all the actions aiming at its amendment.Calendar error in the release of 2022 Population Census: Population by age and sex - Persons aged 60 years and over publication
Published date: 01/11/2023
Description:
Error, pinpointed by the IBGE, for not publishing the release date of the document titled "2022 Population Census: Population by age and sex - Persons aged 60 years and over" in the release calendar. The document was produced to complement the "2022 Population Census: Population by age and sex: Results of the universe" publication, released on October 27, 2023. Aware of the relevance of this theme, the text specifically deals with the population aged 60 years and over, which are the people considered Elderly persons according to the Statute of Elderly Persons.Actions: Release of a Highlight on the availability of the "2022 Population Census: Population by age and sex - Persons aged 60 years and over" document.
Calendar error in the release of the “2022 Population Census: Population by age and sex - Results of the universe” publication
Published date: 04/10/2023
Description:
Error, pinpointed by the IBGE, for not meeting the minimum 30-day anticipation to inform the public on the release date of the 2022 Population Census: Population by age and sex - Results of the universe publication, released on June 28, 2023. The release and updating will occur on October 27, 2023.Actions: The Highlight has been published on October 4, 2023.
Calendar error in release of “2022 Population Census: Indigenous: First results of universe” publication
Published date: 25/07/2023
Description:
An error, pinpointed by the IBGE, for not meeting a minimum of 30 days to inform the public the release date of the 2022 Population Census: Indigenous: First results for the universe publication. The release will be on August 7, 2023.Actions: The release notice updated on July 11, 2023 was once again updated on this date, informing the postponement of the date from August 2 to August 7, 2023.
Correction in the Oracle database and BME concerning specific variables on Indians
Published date: 05/02/2018
Description: Some registers of non-Indian persons or persons who did not live in Indian lands received incorrect values in specific variables of this subject.
Actions: The file was corrected and replaced in the Oracle database and BME.
Complementation of the nomenclature of the cells of the vector files of the Statistical Grid of the 2010 Census
Published date: 06/10/2016
Description: Complementation of the nomenclature of the cells of the grid, maintaining its statistical content and spatial characteristics unchanged.
Actions: The vector files have been replaced.
Complementation of nomenclature for cells of vector files of the Statistical Grid for the 2010 Census
Published date: 06/10/2016
Description: Complementation of the nomenclature of the grid cells, without change of the statistical content or of spatial characteristics.
Actions: Vector files replaced.
Correction of a secondary error in the Results of the Universe - Census
Published date: 28/07/2015
Description: Difference detected among totals of the same variables in different spreadsheets of the Aggregate by enumeration area of the universe - 2010 Census.
Actions: Correction in the database with indication in the news list of the page that accesses the database.
Amendment of a secondary error in Results of the Universe - 2010 Census
Published date: 25/05/2015
Description: Difference detected among total figures of the same variables in different spreadsheets of the Aggregate by enumeration area of the universe - 2010 Census.
Actions: Amendment in database, indicating the access page to the database in the news list.